

The trade-off between number and size of offspring in humans and other primates
- PMID: 18077252
- PMCID: PMC2596903
- DOI: 10.1098/rspb.2007.1511
The trade-off between number and size of offspring in humans and other primates
Abstract
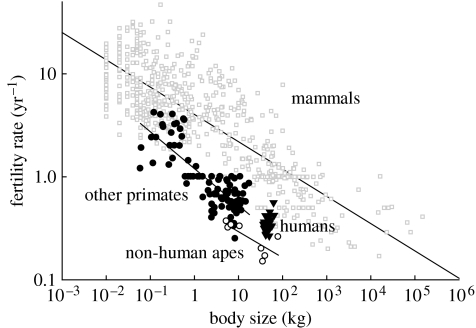
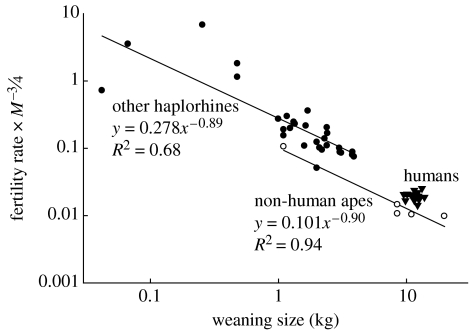
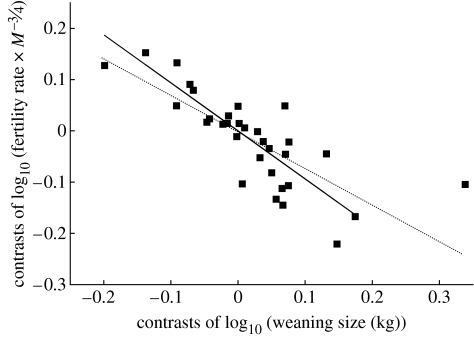
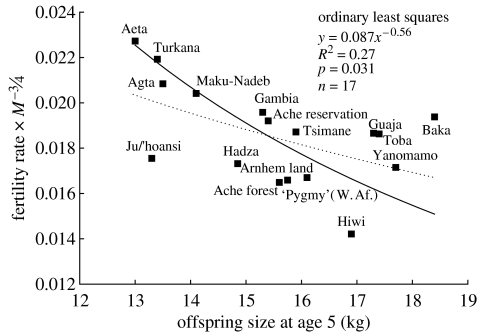
Life-history theory posits a fundamental trade-off between number and size of offspring that structures the variability in parental investment across and within species. We investigate this 'quantity-quality' trade-off across primates and present evidence that a similar trade-off is also found across natural-fertility human societies. Restating the classic Smith-Fretwell model in terms of allometric scaling of resource supply and offspring investment predicts an inverse scaling relation between birth rate and offspring size and a (-1/4) power scaling between birth rate and body size. We show that these theoretically predicted relationships, in particular the inverse scaling between number and size of offspring, tend to hold across increasingly finer scales of analyses (i.e. from mammals to primates to apes to humans). The advantage of this approach is that the quantity-quality trade-off in humans is placed into a general framework of parental investment that follows directly from first principles of energetic allocation.
Figures
References
-
- Alvarez H.P. Grandmother hypothesis and primate life histories. Am. J. Phys. Anthropol. 2000;113:435–450. doi:10.1002/1096-8644(200011)113:3<435::AID-AJPA11>3.0.CO;2-O - DOI - PubMed
-
- Barrickman, N. L., Bastian, M. L., Isler, K. & van Schaik, C. P. In press. Life history costs and benefits of increased brain size: A comparative test using data from long-term studies of primates in the wild. J. Hum. Evol - PubMed
-
- Billewicz W.Z, McGregor I.A. The demography of two West African (Gambian) villages, 1951–75. J. Biosoc. Sci. 1981;13:219–240. - PubMed
-
- Billington B.P. Food consumption and dietary levels of groups of Aborigines living on naturally occurring foods. In: Mountford C.P, editor. Records of the American–Australian scientific expedition to Arnhem Land. Anthropology and nutrition. vol. 2. Melbourne University Press; Melbourne, Australia: 1948. pp. 90–143.
-
- Bininda-Emonds O.R.P, et al. The delayed rise of present-day mammals. Nature. 2007;446:507–512. doi:10.1038/nature05634 - DOI - PubMed
Publication types
MeSH terms
LinkOut - more resources
Full Text Sources
Molecular Biology Databases