. 2007 Dec 18;104(51):20496-500.
doi: 10.1073/pnas.0707122105. Epub 2007 Dec 12.

Sickle cell vasoocclusion and rescue in a microfluidic device

Affiliations

Sickle cell vasoocclusion and rescue in a microfluidic device

J M Higgins et al. Proc Natl Acad Sci U S A. .

Abstract

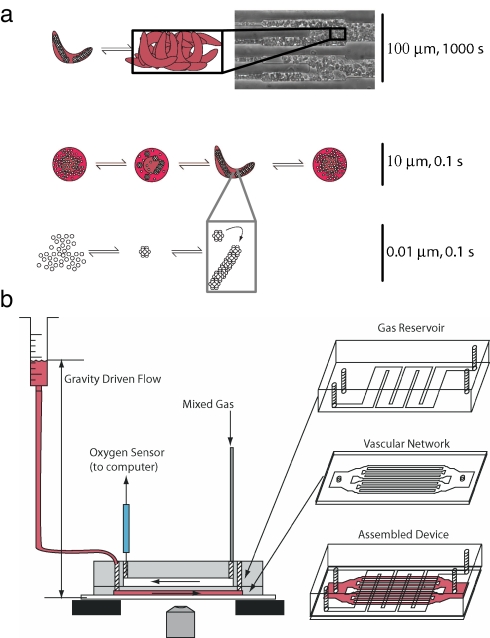
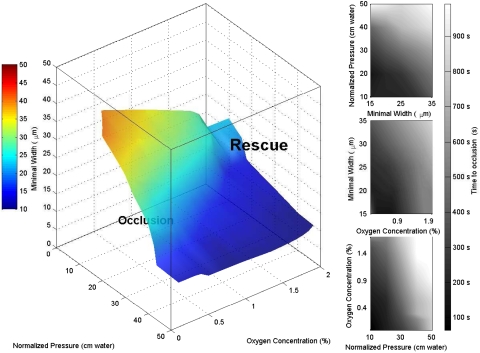
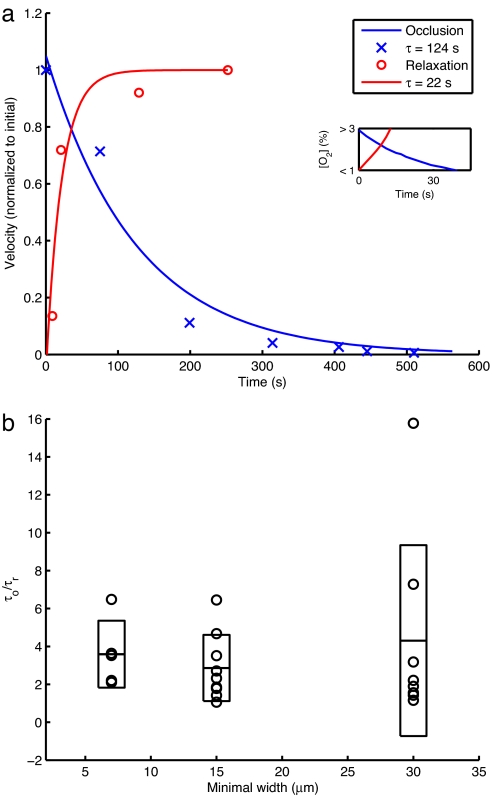
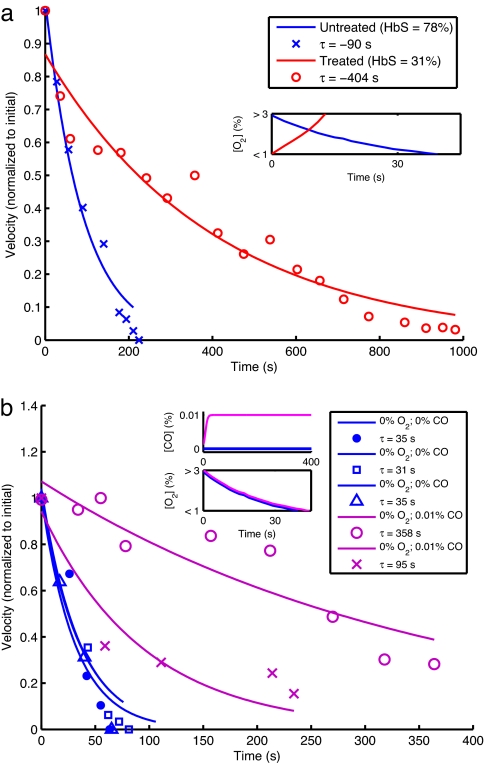
The pathophysiology of sickle cell disease is complicated by the multiscale processes that link the molecular genotype to the organismal phenotype: hemoglobin polymerization occurring in milliseconds, microscopic cellular sickling in a few seconds or less [Eaton WA, Hofrichter J (1990) Adv Protein Chem 40:63-279], and macroscopic vessel occlusion over a time scale of minutes, the last of which is necessary for a crisis [Bunn HF (1997) N Engl J Med 337:762-769]. Using a minimal but robust artificial microfluidic environment, we show that it is possible to evoke, control, and inhibit the collective vasoocclusive or jamming event in sickle cell disease. We use a combination of geometric, physical, chemical, and biological means to quantify the phase space for the onset of a jamming event, as well as its dissolution, and find that oxygen-dependent sickle hemoglobin polymerization and melting alone are sufficient to recreate jamming and rescue. We further show that a key source of the heterogeneity in occlusion arises from the slow collective jamming of a confined, flowing suspension of soft cells that change their morphology and rheology relatively quickly. Finally, we quantify and investigate the effects of small-molecule inhibitors of polymerization and therapeutic red blood cell exchange on this dynamical process. Our experimental study integrates the dynamics of collective processes associated with occlusion at the molecular, polymer, cellular, and tissue level; lays the foundation for a quantitative understanding of the rate-limiting processes; and provides a potential tool for optimizing and individualizing treatment, and identifying new therapies.


Conflict of interest statement

The authors declare no conflict of interest.

Figures

Fig. 1.
Fig. 1.
Schematic of vasoocclusion and experimental setup. (a) Multiscale schematic of the collective processes of vasoocclusion: polymerization of HbS occurring at the 10-nm length scale, cell sickling at the 10-μm length scale, and vessel jamming at up to 100 μm. The time scales for the different processes range from a fraction of a second for polymerization to a few minutes before a vasoocclusive event: jamming of the artificial vessel by deformed and rigid red blood cells. (b) Fabrication and schematic of the device. The oxygen channels and vascular network were fabricated in separate steps, bonded via oxygen plasma activation, and attached to a glass slide. The widest cross-section in the vascular network on the left and right of the device is 4 mm × 12 μm. The vascular network then bifurcates, maintaining a roughly equal total cross-sectional area. The gas channels were connected to two rotameters regulating the gas mixture that was fed into the device. The outlet of the gas network had an oxygen sensor to validate the oxygen concentration in the microchannels.
Fig. 2.
Fig. 2.
Phase space of vasoocclusion. The surface represents a fitted hypersurface in four-dimensional space: width, pressure, oxygen concentration, and occlusion time. The isosurface was computed from 43 data points by using Delaunay triangulation [see the MATLAB griddata3 function documentation (MathWorks)]. All points on the hypersurface correspond to triples of width, pressure, and oxygen concentration where the fitted time to occlusion was 500 sec. The color of each point on the surface characterizes the minimal width in the device and is redundant with the point's vertical (width) coordinate. Pressures were normalized for hematocrit and for individual device resistance (see Pressure Normalization in SI Text). The filled contour plots represent slices through the fitted volume at specific planes (Top, oxygen concentration = 0.5%; Middle, normalized pressure = 20 cm H2O; Bottom, minimal width = 25 μm). This phase space describes the behavior of patient samples with a HbS fraction of at least 65% (mean 86%, standard deviation 6.7%). The stochasticity in the vasoocclusive event leads to large variations about the mean time for jamming. We characterize the deviations from the mean time to occlusion by X = 1/n Σ |tfittactual|/tactual. We find that X is 46%; i.e., vasoocclusion is highly heterogeneous temporally. See SI Movie 7 for a three-dimensional visualization.
Fig. 3.
Fig. 3.
Occlusion and relaxation and their hysteresis. (a) Velocity profiles for an occlusion and relaxation assay for a device with a minimal width of 30 μm and a blood sample with 92% HbS. Data points represent measured velocities normalized to the maximum within each assay. Lines represent least-squares exponential fits. The occlusion measurements had a time scale of ≈124 sec, whereas the corresponding time scale fit to the relaxation profile was ≈22 sec. We note that the velocity of the red blood cells actually does vanish on occlusion. (Inset) Oxygen concentration profiles as measured during a control experiment detailed in Methods. Our velocity profile measurements begin with measurable changes in velocity that will occur when intracellular oxygen concentration drops below 3% or rises above 1% (see Methods for more details). (b) Ratios of characteristic occlusion and relaxation times for occlusion and relaxation assays in devices with different minimal widths. The circles represent individual data points (five at 7 μm, nine at 15 μm, and eight at 30 μm). The horizontal bars represent sample means. The rectangles represent the extent of the mean ± sample SD. For more details, see Occlusion and Rescue Hysteresis in SI Text.
Fig. 4.
Fig. 4.
Effect of perturbations on occlusion. (a) Velocity profiles for occlusion of a patient blood sample before and after therapeutic red blood cell exchange as measured in a device with a minimal diameter of 30 μm and ambient oxygen concentration that is suddenly reduced to 0%. Velocities are normalized to the maximum within each assay. The blue data points represent the behavior of the patient's sample before treatment (78% HbS). The red data points represent the behavior of a sample obtained after treatment (31% HbS). The lines represent least-squares exponential fits. Note that the velocity of the untreated specimen vanishes after a finite time, whereas that of the treated specimen never vanishes. (Inset) Oxygen concentration profiles as measured during a control experiment detailed in Methods. (b) Velocity profiles for occlusion with and without carbon monoxide. All assays were carried out in a device with a minimal diameter of 15 μm and a patient blood sample with 85.5% HbS. The blue markers correspond to three different occlusion assays with no oxygen or carbon monoxide. The purple markers correspond to assays with 0.01% carbon monoxide and 0% oxygen. (Insets) Gas concentration profiles, with Lower Inset reflecting control measurements detailed in Methods.

References

    1. Pauling L, Itano HA, Singer SJ, Wells IC. Science. 1949;110:543–548. - PubMed
    1. Eaton WA, Hofrichter J. Adv Protein Chem. 1990;40:63–279. - PubMed
    1. Mozzarelli A, Hofrichter J, Eaton WA. Science. 1987;237:500–506. - PubMed
    1. Gregersen MI, Bryant CA, Hammerle WE, Usami S, Chien S. Science. 1967;157:825–827. - PubMed
    1. Alexy T, Pais E, Armstrong JK, Meiselman HJ, Johnson CS, Fisher TC. Transfusion. 2006;46:912–918. - PubMed

Publication types

MeSH terms