. 2007 Dec 18;104(51):20576-81.
doi: 10.1073/pnas.0707574105. Epub 2007 Dec 11.

Single-vesicle imaging reveals that synaptic vesicle exocytosis and endocytosis are coupled by a single stochastic mode

Affiliations

Single-vesicle imaging reveals that synaptic vesicle exocytosis and endocytosis are coupled by a single stochastic mode

J Balaji et al. Proc Natl Acad Sci U S A. .

Abstract

The nature of synaptic vesicle recycling at nerve terminals has been a subject of considerable debate for >35 years. Here, we report the use of an optical strategy that allows the exocytosis and retrieval of synaptic components to be tracked in real time at single-molecule sensitivity in living nerve terminals. This approach has allowed us to examine the recycling of synaptic vesicles in response to single action potentials. Our results show that, after exocytosis, individual synaptic vesicles are retrieved by a stochastic process with an exponential distribution of delay times, with a mean time of approximately 14 s. We propose that evidence for fast endocytosis, such as that proposed to support the presence of kiss-and-run, is likely explained by the stochastic nature of a slower process.


Conflict of interest statement

The authors declare no conflict of interest.

Figures

Fig. 1.
Fig. 1.
Improvements in pHluorin detection. (A and B) Images of the vGlut1-pHluorin-transfected hippocampal boutons before and after addition of NH4Cl. (C) The ensemble average of the fluorescence intensity at boutons indicates a ≈17-fold increase in fluorescence corresponding to a surface fraction of 2 ± 0.8% assuming an initial vesicular pH = 5.5 (nine neurons, ≈50 boutons each). (D) Fluorescence intensity of single EGFP molecules. Smoothened surface plot (3 × 3) of GFP in polyacrylamide gel before and after bleaching is shown in D and E, respectively. (F) Intensity profile of a fluorescence spot (circles). A Gaussian fit (line) yields a FWHM of 2.8, in excellent agreement with point spread function measured from 100-nm beads in our setup. (G) Intensity distribution of fluorescent puncta before bleaching is well fit (reduced χ2 = 0.98) by a set of Gaussians whose spacings are exact integer multiples (Inset, linear fit, slope = 58 ± 3 fluorescence units per peak, R = 0.998). (H) Distribution of the change in fluorescence of the puncta after bleaching ΔF (FprebleachFpostbleach) (bars) shows peaks at 0, 64, and 134. Solid line is the overall fit, and dotted lines are the individual Gaussian fits.
Fig. 2.
Fig. 2.
Optical detection of single-vesicle responses. Image of vGlut1-pHluorin-transfected hippocampal boutons before (A) and after (B) applying a one-AP stimulus. Arrowheads point to some of the responding boutons. (Scale bar: 10 μm.) (C) The gray line is the average of single action potential response over 120 events. The black line is the fit to a double exponential describing endocytosis followed by reacidification (see Materials and Methods). The fit yields a time constant for endocytosis of 15 ± 1 s. (D) In the presence of bafilomycin (red trace), repeated stimulation at 0.2 Hz results in a continuous staircase increase in fluorescence, whereas in the control run (black trace), endocytosis and reacidification balance the exocytic-driven increase. (E) The cumulative histogram of the response amplitudes to single AP in the absence (squares) and presence (circles) of bafilomycin (three neurons, 165 boutons) are identical (Kolmogorov–Smirnov test maximal D value =0.1, which corresponds to P = 1.000 that the distributions are the same), indicating all fusion events that release protons contribute to the signal.
Fig. 3.
Fig. 3.
Distribution of instantaneous fluorescence changes. (A) Representative fluorescence time traces of individual boutons during repeated stimulation (indicated by arrows). An example of the amplitude of the first event (ΔF1AP) is shown in the top upper left trace. (B) The distribution of instantaneous fluorescence change amplitudes from individual boutons associated with single-AP stimuli (ΔF1AP) shows integer multiples of quantized fluorescence intensities. The data (540 events) were obtained from 30 boutons in 1.5 (four trials), 2 (four trials), 2.5 (three trials), 3.5 (three trials), and 4 mM (four trials) CaCl2. The solid and dotted black lines are the overall and individual fits to multiple Gaussians, respectively (reduced χred2 = 0.97). The coefficient of variation for the first nonzero peak is 0.37. (C) The peak positions obtained as a fit parameter in B are integer multiples indicating that ΔF1AP are distributed as multiples of a fundamental quantal unit (r = 0.998).
Fig. 4.
Fig. 4.
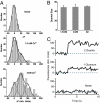
Quantal size is invariant across different release probability. (A) Noise distributions (Top) obtained in the absence of stimulation. The solid line is a Gaussian fit (χred2 = 0.6). Middle and Bottom show quantal histograms (bars) obtained by measuring the ΔF1AP with 1.5 (224 events) and 4 mM (186 events) external calcium, respectively, taken from the same ensemble data as in Fig. 3. The distribution is fit [solid line, χred2 = 0.5 (1.5 mM), χred2= 1.3 (4 mM)] to multiple Gaussians (dashed lines are the individual Gaussian components). The CV for the first nonzero peaks is 0.38 (1.5 mM) and 0.40 (4 mM). (B) Comparison of quantal size determined from 1.5- and 4-mM histogram, and histogram of all events (Fig. 3B) shows that the quantal size is invariant. (C) Illustrative example of time traces from single boutons that we classify as no response; one quantum and two quanta are shown in Bottom, Middle, and Top, respectively.
Fig. 5.
Fig. 5.
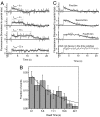
Single-vesicle endocytic dwell time follows an exponential distribution with a mean lifetime of ≈14 s. (A) Fluorescence traces obtained at individual boutons after single-vesicle exocytosis. Gray lines are raw time traces, and the black line is the running average over 13 points (≈2 s). The endocytic dwell time is defined as tdwell = t1/2 −τr ln(2), where t1/2 is the time to decay to 50% of the peak amplitude, and τr is the reacidification time constant (4 s). (B) Frequency distribution of dwell times obtained from 150 single-vesicle events obtained from four neurons. Bars are the fraction of events decayed in that time bin, and error bar is the Poissonian noise estimated from the number of events in that bin. All events that did not decay within the observed time (such as the lower trace in A) are collected in the final bin (not shown) and included for calculating the fraction of events. The solid line is a fit to a Poisson distribution. The time constant for a Poisson distribution can be estimated from the exponential and gives 13.4 ± 2.4 s as well as reciprocal of the amplitude of the exponential divided by the bin width, which gives 15.0 ± 1.5 s. The fraction of events that remain undecayed within the observation time is in good agreement with that obtained by integrating the exponential fit (17.3%). (C) Average of five events from bins centered at 0.1, 2.85, and 8.35 s along with average of five events that did not decay during the observation time window is shown. The solid-gray exponential decays are fits to the reacidification time course. The average time constant from the fit is 3.8 ± 1.8 s.

References

    1. Yamashita T, Hige T, Takahashi T. Science. 2005;307:124–127. - PubMed
    1. Newton AJ, Kirchhausen T, Murthy VN. Proc Natl Acad Sci USA. 2006;103:17955–17960. - PMC - PubMed
    1. Ferguson SM, Brasnjo G, Hayashi M, Wolfel M, Collesi C, Giovedi S, Raimondi A, Gong LW, Ariel P, Paradise S, et al. Science. 2007;316:570–574. - PubMed
    1. Granseth B, Odermatt B, Royle SJ, Lagnado L. Neuron. 2006;51:773–786. - PubMed
    1. von Gersdorff H, Matthews G. Nature. 1994;367:735–739. - PubMed

Publication types