. 2007 Dec 18;104(51):20256-61.
doi: 10.1073/pnas.0706914105. Epub 2007 Dec 11.

Dodecamer rotor ring defines H+/ATP ratio for ATP synthesis of prokaryotic V-ATPase from Thermus thermophilus

Affiliations

Dodecamer rotor ring defines H+/ATP ratio for ATP synthesis of prokaryotic V-ATPase from Thermus thermophilus

Masashi Toei et al. Proc Natl Acad Sci U S A. .

Abstract

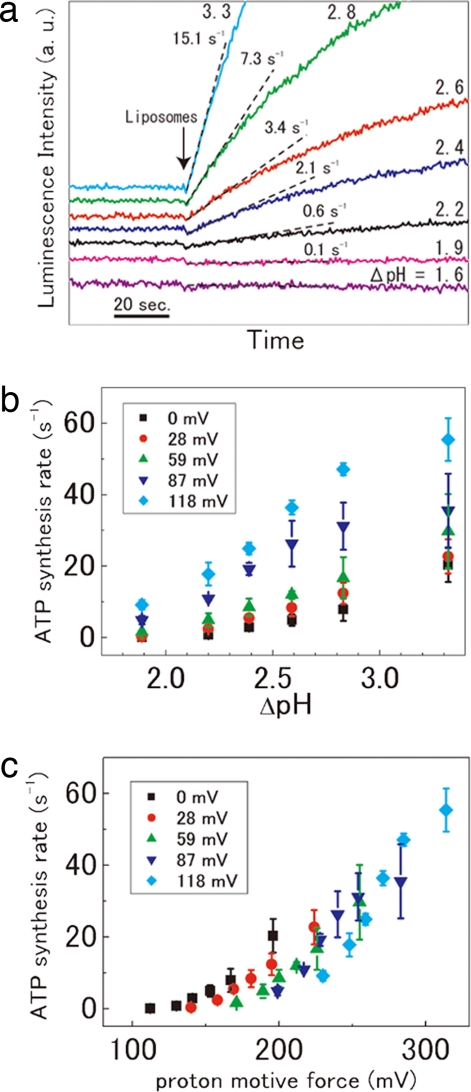
ATP synthesis by V-ATPase from the thermophilic bacterium Thermus thermophilus driven by the acid-base transition was investigated. The rate of ATP synthesis increased in parallel with the increase in proton motive force (PMF) >110 mV, which is composed of a difference in proton concentration (DeltapH) and the electrical potential differences (DeltaPsi) across membranes. The optimum rate of synthesis reached 85 s(-1), and the H(+)/ATP ratio of 4.0 +/- 0.1 was obtained. ATP was synthesized at a considerable rate solely by DeltapH, indicating DeltaPsi was not absolutely required for synthesis. Consistent with the H(+)/ATP ratio, cryoelectron micrograph images of 2D crystals of the membrane-bound rotor ring of the V-ATPase at 7.0-A resolution showed the presence of 12 V(o)-c subunits, each composed of two transmembrane helices. These results indicate that symmetry mismatch between the rotor and catalytic domains is not obligatory for rotary ATPases/synthases.


Conflict of interest statement

The authors declare no conflict of interest.

Figures

Fig. 1.
Fig. 1.
Measurement of ATP synthesis of the prokaryotic V-ATPase from T. thermophilus. (a) Schematic model for the V-ATPase of T. thermophilus and experimental system. The isolated V-ATPase was reconstituted into liposomes, then energized by an acid-base transition procedure described in Materials and Methods. (b) Raw data of ATP synthesis of the V-ATPase at a ΔpH of 3.3. The proteoliposomes were acidified by soaking in 100 mM maleinate buffer. The reactions were initiated by the addition of acidified proteoliposomes into the base buffer, as indicated by the arrows. The ΔΨ was generated by the addition of different K+ concentrations to the outside of the proteoliposomes in the presence of 36 nM valinomycin. The ΔΨ was calculated from the Nernst equation: ΔΨ = 2.303 RT/F log[Kout+]/[Kin+]. The generated ΔΨ is represented; 118, 87, 59, 28, and 0 mV of ΔΨ correspond to 100, 30, 10, 3, and 1 mM [Kout+], respectively. −V-ATPase, liposomes without V-ATPase; +FCCP, in the presence of 50 μM FCCP at 118 mV of ΔΨ. Final concentrations are 0.05 mg/ml of VoV1, 1.1 mM ADP, and 200 nM ATP.
Fig. 2.
Fig. 2.
Effect of ΔpH and ΔΨ on the ATP synthesis of the V-ATPase. (a) Raw data for ATP synthesis by V-ATPase in the absence of ΔΨ ([Kout+] = [Kin+] = 1 μM). The proteoliposomes were acidified by soaking in 100 mM Mes buffer, pH 4.7, 5.3, 5.7, 6.1, and 6.4, respectively. (b) The ATP synthesis rate as a function of ΔpH in the presence of constant ΔΨ, 0 mV (black squares), 28 mV (red circles), 59 mV (green triangles), 87 mV (blue triangles), and 118 mV (blue squares). The data are the average of three or four measurements. The error limits are standard deviations. (c) ATP synthesis rate as a function of PMF calculated by the equation; PMF (mV) = 2.303 RT/F ΔpH + ΔΨ.
Fig. 3.
Fig. 3.
Rate of ATP synthesis at various [ATP]/[ADP][Pi] ratios. (a) The raw data of ATP synthesis reaction at each [ATP]/[ADP][Pi] ratio (A–D) summarized in Table 1. Each set of raw data was corrected for its baseline. The luminescence was calibrated by the addition of standard ATP. The different ΔpHeq values are given next to each trace. (b) ATP synthesis and hydrolysis as a function of ΔpH. Each symbol represents data at different [ATP]/[ADP][Pi] ratio conditions (A–D). Arrows indicate ΔpHeq, where the ATP synthesis rate becomes zero. The data are the average of three to seven measurements. The error limits are the standard deviations. (c) The energy contribution resulting from the [ATP]/[ADP][Pi] ratio as a function of Δμ̃H+eq given as the Eq. 3. Error bars in symbols are based on standard error values at each [ATP]/[ADP][Pi] ratio condition (see SI Table 3). The slope gives the H+/ATP ratio of n, and the y intercept gives the standard Gibbs free energy of ΔGo. The estimated n value of 4.0 ± 0.1 from four data points has a 95% confidence interval of 3.7–4.3.
Fig. 4.
Fig. 4.
Formation of 2D crystals and projection map. (A) Micrograph of a uranyl acetate-stained 2D crystal. (B) The projection map, calculated from seven merged images, at 7.0-Å resolution, showing an orthogonal arrangement of dodecameric rings. One unit cell is outlined and has the dimensions of a = 83.5 ± 0.6 Å, b = 83.5 ± 0.6 Å, and γ = 90.4 ± 0.4°.

References

    1. Imamura H, Nakano M, Noji H, Muneyuki E, Ohkuma S, Yoshida M, Yokoyama K. Proc Natl Acad Sci USA. 2003;100:2312–2315. - PMC - PubMed
    1. Nishi T, Forgac M. Nat Rev Mol Cell Biol. 2002;3:94–103. - PubMed
    1. Boyer PD. Biochim Biophys Acta. 1993;1140:215–250. - PubMed
    1. Yoshida M, Muneyuki E, Hisabori T. Nat Rev Mol Cell Biol. 2001;2:669–677. - PubMed
    1. Murata T, Yamato I, Kakinuma Y. J Bionenerg Biomembr. 2005;37:411–413. - PubMed

Publication types

MeSH terms

LinkOut - more resources