. 2007 Dec 18;104(51):20392-7.
doi: 10.1073/pnas.0706461104. Epub 2007 Dec 11.

Estimation of multiple transmission rates for epidemics in heterogeneous populations

Affiliations

Estimation of multiple transmission rates for epidemics in heterogeneous populations

Alex R Cook et al. Proc Natl Acad Sci U S A. .

Abstract

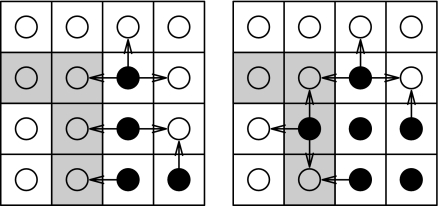
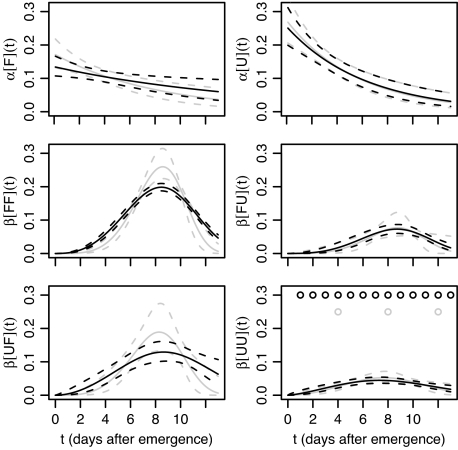
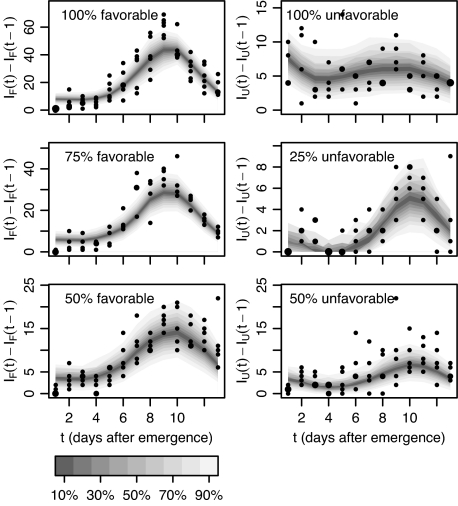
One of the principal challenges in epidemiological modeling is to parameterize models with realistic estimates for transmission rates in order to analyze strategies for control and to predict disease outcomes. Using a combination of replicated experiments, Bayesian statistical inference, and stochastic modeling, we introduce and illustrate a strategy to estimate transmission parameters for the spread of infection through a two-phase mosaic, comprising favorable and unfavorable hosts. We focus on epidemics with local dispersal and formulate a spatially explicit, stochastic set of transition probabilities using a percolation paradigm for a susceptible-infected (S-I) epidemiological model. The S-I percolation model is further generalized to allow for multiple sources of infection including external inoculum and host-to-host infection. We fit the model using Bayesian inference and Markov chain Monte Carlo simulation to successive snapshots of damping-off disease spreading through replicated plant populations that differ in relative proportions of favorable and unfavorable hosts and with time-varying rates of transmission. Epidemiologically plausible parametric forms for these transmission rates are compared by using the deviance information criterion. Our results show that there are four transmission rates for a two-phase system, corresponding to each combination of infected donor and susceptible recipient. Knowing the number and magnitudes of the transmission rates allows the dominant pathways for transmission in a heterogeneous population to be identified. Finally, we show how failure to allow for multiple transmission rates can overestimate or underestimate the rate of spread of epidemics in heterogeneous environments, which could lead to marked failure or inefficiency of control strategies.


Conflict of interest statement

The authors declare no conflict of interest.

Figures

Fig. 1.
Fig. 1.
Dynamics of infection in a heterogeneous host population comprising unfavorable (U, gray squares) and favorable (F, white squares) sites. The state of an epidemic is shown for two time points, with solid circles indicating infected hosts and empty circles indicating susceptible hosts. The arrows represent potential transmission routes between infected and neighboring susceptible sites. The figure shows how the localized conditions change with time and how the disease load depends on the relative strength of each of the four possible transmission rates β[., .]. (Left) Total infective challenge on F is 4β[F, F] and 3β[F, U] on U. (Right) As more hosts become infected, this challenge changes to 3β[F, F] + β[U, F] on F and 2β[F, U] + 2β[U, U] on U. Even though the number of transmission pathways has increased from seven to eight, the combined effective challenge may be greater or less than in Left, depending on the relative strength of each of the four transmission rates.
Fig. 2.
Fig. 2.
Posterior means (solid curves) and 95% credible intervals (dashed curves) for primary [α[F](t) and α[U](t)] and each of the four secondary [β[FF](t), β[FU](t), β[UF](t), and β[UU](t)] transmission rates against time. Results using the full spatiotemporal data are shown in black (with observations at times indicated by black circles in the lower right plot), and the corresponding results, with all but three observations at times 4, 8, and 12 discarded, are shown in gray.
Fig. 3.
Fig. 3.
Posterior predictive new infections of daily increments (shaded region corresponds to credible intervals) with observations (points, area of symbols are proportional to the number of observations) for damping-off epidemics in mixed populations comprising 100%, 75%, 50%, or 0% favorable hosts. Predictions take the form of mixture distributions with each component conditional on the previous spatial observation of disease presence in an experimental replicate. Predictions take account of both parametric uncertainty and population stochasticity. IF(t) and IU(t) denote the number of infected favorable and unfavorable hosts at time t, respectively.
Fig. 4.
Fig. 4.
Nature and effects of the spatial structure of heterogeneity. When 75% of the population is favorable (a, gray squares), they form a well connected network. At 50%, both favorable and unfavorable (d, white squares) sites form isolated patches. The effect of the fraction of sites in the population that is favorable (b) or unfavorable (e) and the proportion of neighbors of the same type (c and f), a measure of clustering, on levels of disease, with (continuous lines and solid circles) or without (dashed lines and empty circles) inclusion of transmission of disease between favorable and unfavorable sites in the population.

References

    1. Gibson GJ, Kleczkowski A, Gilligan CA. Proc Natl Acad Sci USA. 2004;101:12120–12124. - PMC - PubMed
    1. Gibson GJ, Otten W, Filipe JAN, Cook A, Marion G, Gilligan CA. Stat Comput. 2006;16:391–402.
    1. Kwiatkowski DP. Am J Hum Genet. 2005;77:171–190. - PMC - PubMed
    1. Quinn TC, Overbaugh J. Science. 2005;308:1582–1583. - PubMed
    1. Gregson S, Nyamukapa CA, Garnett GP, Mason PR, Zhuwau T, Caraël M, Chandiwana SK, Anderson RM. Lancet. 2002;359:1896–1903. - PubMed

Publication types