. 2007 Dec 11;104(50):19977-82.
doi: 10.1073/pnas.0704620104. Epub 2007 Dec 6.

Mast cells are an essential hematopoietic component for polyp development

Affiliations

Mast cells are an essential hematopoietic component for polyp development

Elias Gounaris et al. Proc Natl Acad Sci U S A. .

Abstract

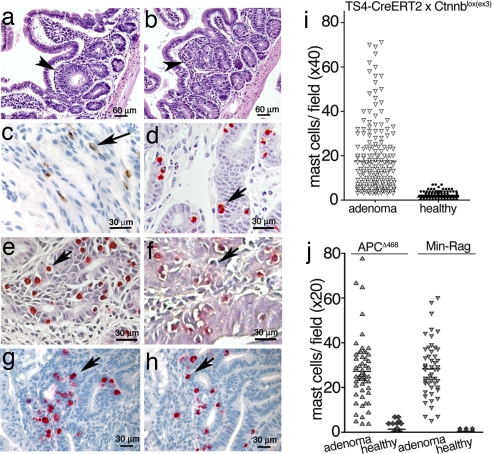
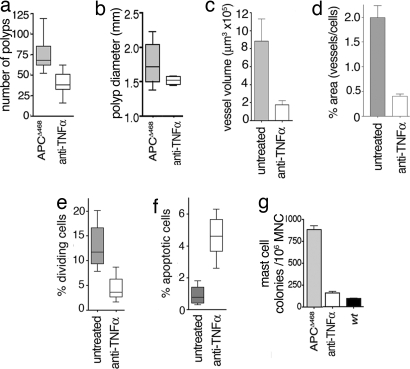
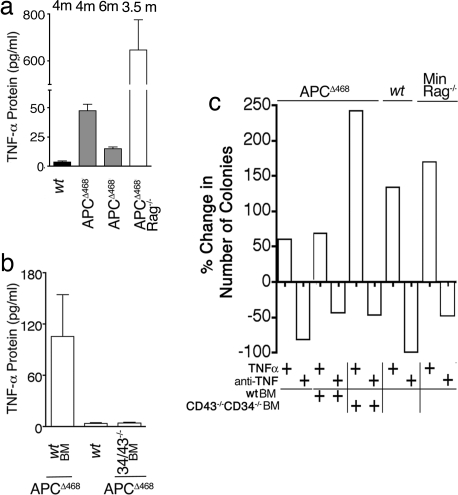
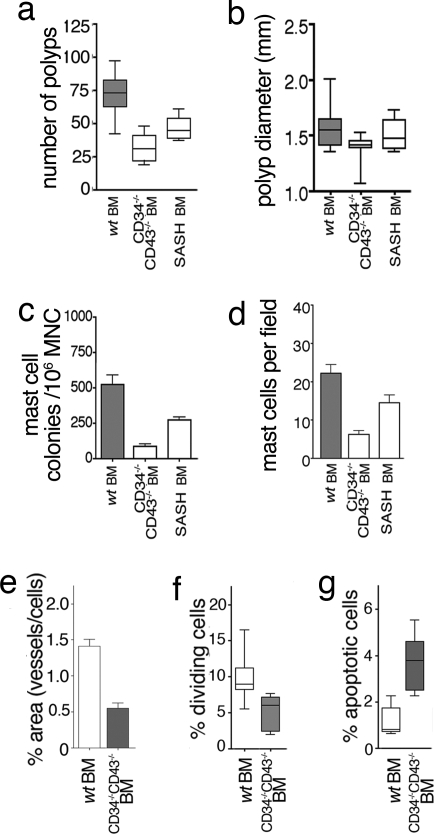
It is generally agreed that most colon cancers develop from adenomatous polyps, and it is this fact on which screening strategies are based. Although there is overwhelming evidence to link intrinsic genetic lesions with the formation of these preneoplastic lesions, recent data suggest that the tumor stromal environment also plays an essential role in this disease. In particular, it has been suggested that CD34(+) immature myeloid precursor cells are required for tumor development and invasion. Here we have used mice conditional for the stabilization of beta-catenin or defective for the adenomatous polyposis coli (APC) gene to reinvestigated the identity and importance of tumor-infiltrating hematopoietic cells in polyposis. We show that, from the onset, polyps are infiltrated with proinflammatory mast cells (MC) and their precursors. Depletion of MC either pharmacologically or through the generation of chimeric mice with genetic lesions in MC development leads to a profound remission of existing polyps. Our data suggest that MC are an essential hematopoietic component for preneoplastic polyp development and are a novel target for therapeutic intervention.


Conflict of interest statement

The authors declare no conflict of interest.

Figures

Fig. 1.
Fig. 1.
MC are enriched in adenomatous polyps. (a–h) Samples embedded in 6-μm paraffin sections or 2-μm plastic (where mentioned) sections. (a–d) TS4-CreERT2 × Ctnnblox(ex3) intestine 2.5 weeks after induction with tamoxifen. (a and b) H&E stain of nascent crypt (a) and aberrant crypt (b). (c) Polyp MC stained with antiCD34-HRP. (d) Polyp MC stained with CAE. Plastic sections are shown. (e and f) APCΔ468 (e) or Min-Rag−/− (f) intestine. Plastic sections were stained with CAE. (g and h) mMCP2 (g) and mMCP6 (h) stainings of APCΔ468 intestine. Arrows indicate MC. (i) MC per field in polyps of tamoxifen-induced CreERT2 × Catnblox(ex3) mice. Shown are the mean frequencies in polyps (17.5 ± 15.4; n = 357) and normal tissue (1.3 ± 1.6) (99% confidence, P < 0.001, ANOVA). (Magnification, ×200.) (j) MC per field in polyps in APCΔ468 (age, 5 months) or Min-Rag−/− (age, 3 months) mice. The mean frequencies of MC in the polyps of APCΔ468 mice (27.4 ± 1.7; n = 63) and Min-Rag−/− mice (28.3 ± 1.7; n = 52) were significantly higher than in the corresponding surrounding tissues (1.2 ± 0.3, and 0.3 ± 0.1, respectively; fields of view, n = 357) (99% confidence, P < 0.001; ANOVA).
Fig. 2.
Fig. 2.
Polyposis requires TNFα. (a) Number of polyps in APCΔ468 mice with (n = 8) and without (n = 8) anti-TNFα treatment (untreated, 66 ± 3.6; treated, 34 ± 4.5, P < 0.001). The results shown are those of at least two independent experiments. (b) Median diameters and 25 and 75 percentiles of polyps (treated, 1.5 mm ± 0.05; untreated, 1.8 mm ± 0.29). (c) Mean blood vessel volumes measured by near-infrared fluorescent imaging (in each case, n = 4). (d) Relative areas covered by CD34+ endothelial cells (blood vessels). Results are from 20 micrographs from each of three mice: wt, 0.03 ± 0.007%; untreated, 1.99 ± 024%; anti-TNFα, 0.40 ± 0.045% (P < 0.001). (Magnification, ×400.) (e) Mitotic Index of adenoma in untreated (mean, 13 ± 1.4%) and anti-TNFα-treated (mean 4.4 ± 0.85%) mice. Results are from eight samples from each of three mice (P < 0.001). (Magnification, ×200.) (f) Mean values of TUNEL activity per field. Results are from 20 microphotographs from each of three mice: untreated polyps, 0.91 ± 0.17; anti-TNFα, 4.5 ± 0.4 (P < 0.001). (Magnification, ×200.) (g) Frequency of MCp among total MNC prepared from the intestine, determined by limiting dilution assay. Mean of three experiments, each with one wt control: APCΔ468, n = 12; anti-TNFα, n = 11; wt, n = 3 (one-way ANOVA with Bonferroni's multiple comparison test).
Fig. 3.
Fig. 3.
Impact of TNFα on MCp frequencies. (a) Levels of TNFα in sera of wt (n = 4), APCΔ468 (n = 6 + 6), or APCΔ468Rag−/− (n = 8) mice were measured by ELISA. Ages shown above each bar are in months (m). Data are from two experiments. (b) Levels of TNFα in sera of mice reconstituted with wt or Cd34−/−Cd43−/− BM or wt mice (n = 3) were measured by ELISA (triplicate measurements). Mice were killed at 5 months of age, 6 weeks after BM reconstitution. (c) Impact of ex vivo addition or depletion of TNFα on the yield of MC colonies was determined by limiting dilution assay. TNFα neutralizing antibody (1 μg/ml; Bioexpress) and soluble TNFα (40 ng/ml; Cell Science) were included in the culture medium. For each treatment, percent increase or decrease relative to untreated mice from three to six assays is shown. Results are statistically significant to 99% confidence (P < 0.001, ANOVA).
Fig. 4.
Fig. 4.
Polyposis requires MC. (a) Number of polyps in APCΔ468 mice, reconstituted with wt BM (60 ± 6.7, n = 10), Cd34−/−Cd43−/− BM (34 ± 4.9, n = 11), or KitW-sh/Wsh (SASH) BM (45 ± 1.5, n = 8). Data are from two independent experiments (P < 0.001 vs. wt). (b) Average diameter of polyps for wt BM (1.6 ± 0.06), Cd34−/−Cd43−/− BM (1.4 ± 0.04), or KitW-sh/Wsh (SASH) BM (1.5 ± 0.05). Median values and 25th and 75th percentiles are shown. (c) Frequencies of MCp determined by limiting dilution assay for wt BM (n = 9), Cd34−/−Cd43−/− BM (n = 9), and SASH BM (n = 8). (d) MC counts in polyps (n = 3 per group). Paraffin sections (6 μm) were stained with CAE and viewed at ×200 magnification. (e) Relative areas covered by CD34+ endothelial cells (blood vessels). Results are from 20 micrographs each of three mice. (Magnification, ×400.) The mean areas of vessels for wt BM and Cd34−/−Cd43−/− BM are 1.41 ± 0.093 and 0.055 ± 0.074, respectively (P < 0.001). (f) Mitotic index of polyps from Cd34−/−Cd43−/− BM (5.0 ± 0.61) and wt BM (9.6 ± 0.72) (P < 0.001). Data are from eight micrographs each of three mice. (Magnification, ×200.) (g) TUNEL activity of polyps for Cd34−/−Cd43−/− BM (3.9 ± 0.46) and wt BM (1.2 ± 0.27). The mean values of apoptotic cells for wt BM and CD34−/−CD43−/− BM are 1.2 ± 0.27 and 3.9 ± 0.46, respectively. Data are from 20 micrographs from each of three mice and are the result one-way ANOVA with Bonferroni's multiple comparison test (P < 0.001). (Magnification, ×200.)

References

    1. Kinzler KW, Nilbert MC, Su LK, Vogelstein B, Bryan TM, Levy DB, Smith KJ, Preisinger AC, Hedge P, McKechnie D, et al. Science. 1991;253:661–665. - PubMed
    1. Levy DB, Smith KJ, Beazer-Barclay Y, Hamilton SR, Vogelstein B, Kinzler KW. Cancer Res. 1994;54:5953–5958. - PubMed
    1. Powell SM, Zilz N, Beazer-Barclay Y, Bryan TM, Hamilton SR, Thibodeau SN, Vogelstein B, Kinzler KW. Nature. 1992;359:235–237. - PubMed
    1. Korinek V, Barker N, Morin PJ, van Wichen D, de Weger R, Kinzler KW, Vogelstein B, Clevers H. Science. 1997;275:1784–1787. - PubMed
    1. Mayer RJ. Gastrointestinal Tract Cancer. New York: McGraw–Hill; 2001.

Publication types

MeSH terms