. 2007 Dec 12;27(50):13614-23.
doi: 10.1523/JNEUROSCI.3455-07.2007.

Mitochondrial sensitivity and altered calcium handling underlie enhanced NMDA-induced apoptosis in YAC128 model of Huntington's disease

Affiliations

Mitochondrial sensitivity and altered calcium handling underlie enhanced NMDA-induced apoptosis in YAC128 model of Huntington's disease

Herman B Fernandes et al. J Neurosci. .

Abstract

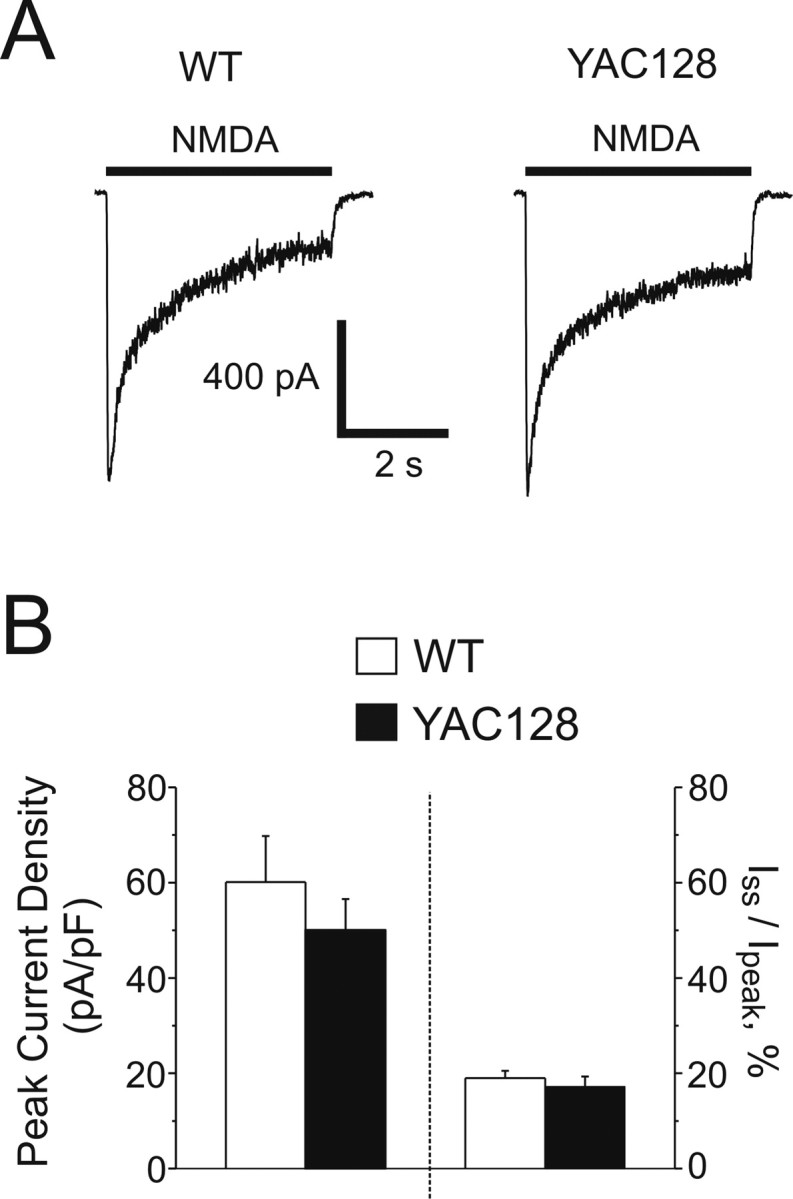
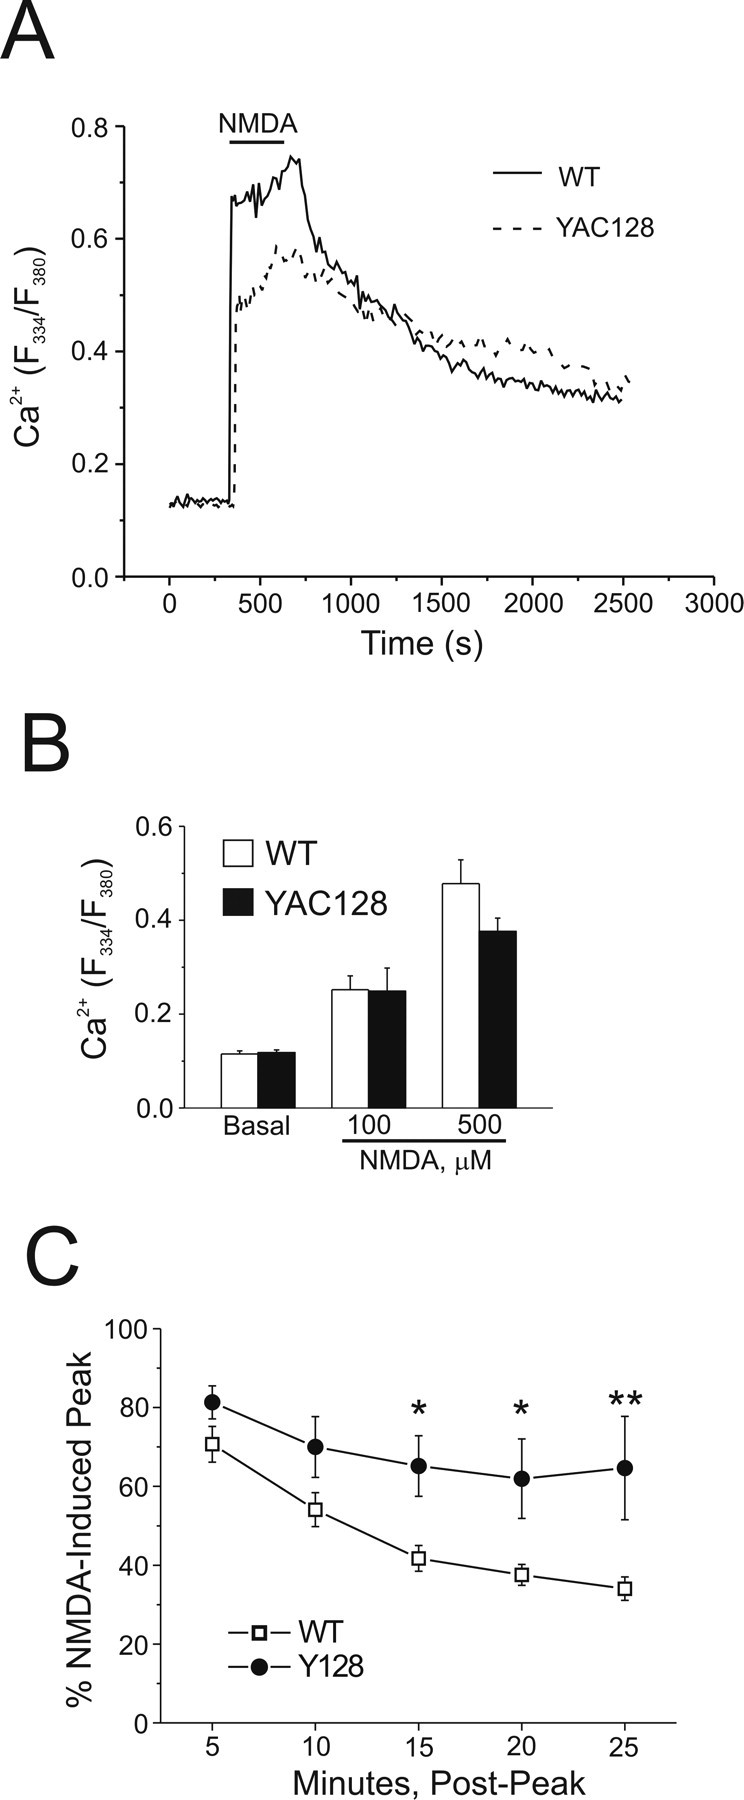
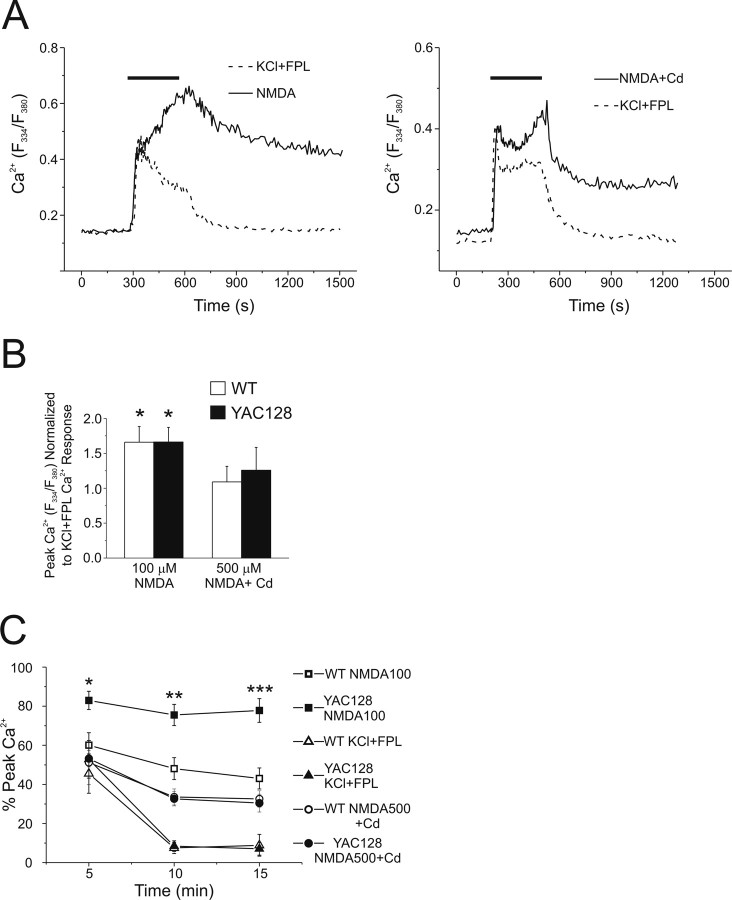
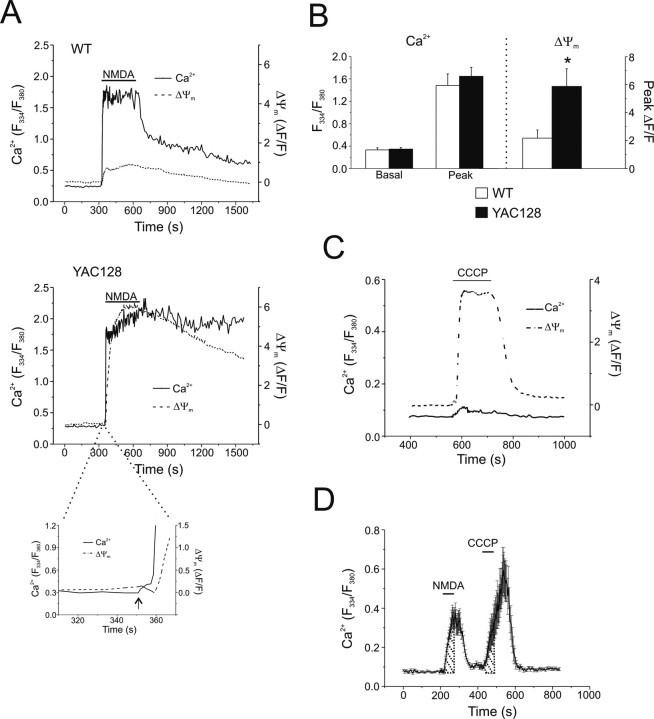
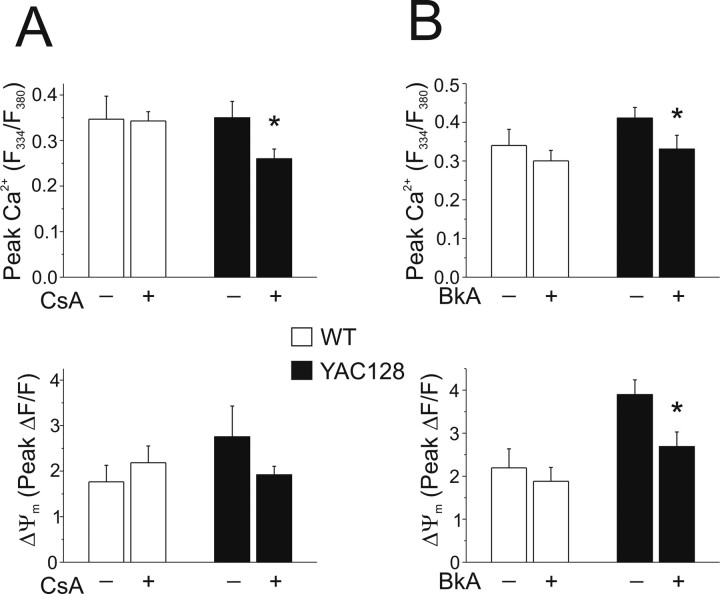
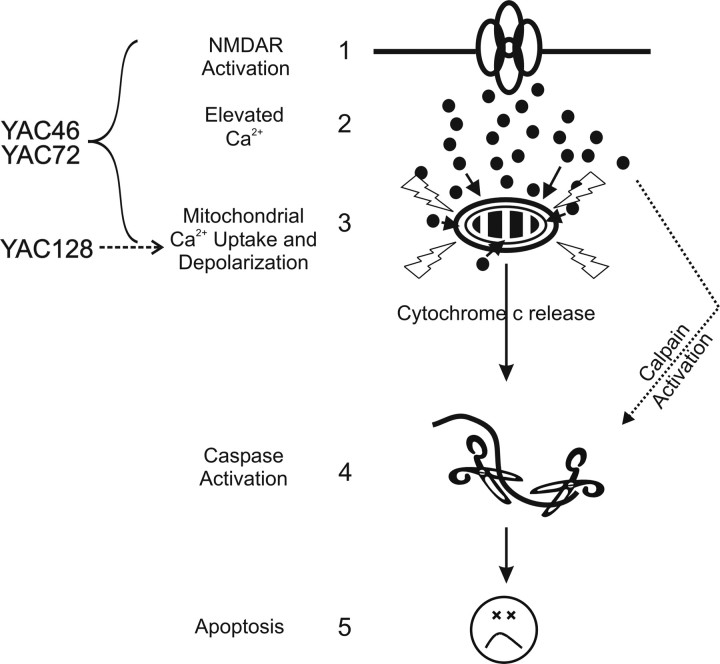
Expansion of a CAG repeat in the Huntington's disease (HD) gene results in progressive neuronal loss, particularly of striatal medium-sized spiny neurons (MSNs). Studies in human HD autopsy brain tissue, as well as cellular and animal models of HD, suggest that increased activity of NMDA-type glutamate receptors and altered mitochondrial function contribute to selective neuronal degeneration. In this regard, the YAC128 mouse model, expressing full-length human huntingtin with 128 glutamine repeats, has been the focus of much interest. Although NMDA-induced apoptosis is enhanced in YAC128 MSNs, here we report that the initial steps in the death signaling pathway, including NMDA receptor (NMDAR) current and cytosolic Ca2+ loading, are similar to those observed in wild-type MSNs. In contrast, we found that the NMDAR-mediated Ca2+ load triggered a strikingly enhanced loss of mitochondrial membrane potential in YAC128 MSNs, suggesting that NMDAR signaling via the mitochondrial apoptotic pathway is altered. This effect was accompanied by impaired cytosolic Ca2+ clearance after removal of NMDA, a difference that was not apparent after high potassium-evoked depolarization-mediated Ca2+ entry. Inhibition of the mitochondrial permeability transition (mPT) reduced peak cytosolic Ca2+ and mitochondrial depolarization evoked by NMDA in YAC128 MSNs but not wild-type MSNs. Hence, in contrast to YAC models with moderate CAG expansions, the enhanced NMDA-induced apoptosis in YAC128 MSNs is predominantly determined by augmented mitochondrial sensitivity to Ca2+-induced activation of the mPT. These results suggest that the CAG repeat length influences the mechanism by which mHtt enhances NMDAR-mediated excitotoxicity.


Figures

Figure 1.
Figure 1.
NMDAR current densities in WT and YAC128 MSNs. A, Representative whole-cell NMDAR currents from WT (left) and YAC128 (right) MSNs, evoked by the application of 1 mm NMDA. B, Left, Mean peak current densities (left y-axis) of WT (open bar, n = 28 cells) and YAC128 (filled bar, n = 20 cells) MSNs, not significant by unpaired t test. Data are expressed as mean ± SEM. Right, Iss/Ipeak values (right y-axis) for WT (19.0 ± 1.5%, n = 28 cells) and YAC128 MSNs (17.2 ± 2.1%, n = 20 cells, not significant by unpaired t test). Data are expressed as mean ± SEM.
Figure 2.
Figure 2.
Cytosolic Ca2+ handling in WT and YAC128 MSNs after NMDA application. Intracellular Ca2+ was monitored using fura-2 in these experiments. A, Representative mean responses of WT (solid line, n = 27 cells) and YAC128 (dashed line, n = 21 cells) MSNs before, during, and after 5 min of application of 500 μm NMDA. B, Basal (n = 10 experiments per genotype, total of 168 and 163 neurons for WT and YAC128, respectively, from 6 different batches of cultured neurons) and peak cytosolic Ca2+ responses to 100 μm NMDA (n = 4 experiments per genotype, total of 73 and 68 neurons for WT and YAC128, respectively, from 2 different culture batches) or 500 μm NMDA (n = 10 experiments per genotype, total of 168 and 163 neurons for WT and YAC128, respectively, from 6 different culture batches) in WT (open bars) or YAC128 (filled bars) MSNs. Not significant by paired t test for WT versus YAC128 basal cytosolic Ca2+ or 100 or 500 μm NMDA; data are expressed as mean ± SEM. C, Recovery of cytosolic Ca2+ toward prestimulus levels after application of 500 μm NMDA in WT (open squares, n = 5 experiments, total of 91 neurons from 3 different culture batches) or YAC128 (filled circles, n = 5 experiments, total of 90 neurons, from 3 different culture batches) MSNs. Repeated-measures ANOVA, effect of genotype, F(1,20) = 33.78, p < 0.0001; effect of time, F(4,20) = 4.04, *p < 0.05; *p < 0.05 at 15 min; *p < 0.05 at 20 min; **p < 0.01 at 25 min by Bonferroni posttest.
Figure 3.
Figure 3.
Contrasting responses of WT and YAC128 MSNs to different stimuli that increase cytosolic Ca2+. Intracellular Ca2+ was monitored using fura-FF in these experiments. A, Left, Representative mean responses of WT MSNs to 100 μm NMDA (solid line, n = 14 cells) or 50 mm KCl + 5 μm FPL64176 (dotted line, n = 23 cells). Right, Representative mean responses of WT MSNs to 500 μm NMDA + 0.2 mm Cd2+ (solid line, n = 19 cells) or 50 mm KCl + 5 μm FPL64176 (dotted line, n = 19 cells). B, Peak cytosolic Ca2+ responses to 100 μm NMDA (n = 6 experiments for WT, n = 5 for YAC128; total of 108 and 86 neurons for WT and YAC128, respectively, from 3 different culture batches) or 500 μm NMDA + 0.2 mm Cd2+ (n = 6 experiments, 98 cells total for WT; n = 6 experiments, 114 cells total for YAC128, from 2 different culture batches per genotype) normalized to peak cytosolic Ca2+ responses to 50 mm KCl + 5 μm FPL64176 (n = 12 experiments per genotype, total of 216 and 211 neurons for WT and YAC128, respectively, from 5 different culture batches) obtained in paired experiments in WT (open bars) or YAC128 (filled bars) MSNs. *p < 0.05 by single-factor t test (significantly different from 1.0). Data are expressed as mean ± SEM. C, Recovery of cytosolic Ca2+ toward prestimulus levels after 5 min of application of 100 μm NMDA (WT: open squares; YAC128: filled squares; n = 5 experiments per genotype, total of 97 and 86 neurons for WT and YAC128, respectively, from 3 different culture batches), 500 μm NMDA + 0.2 mm Cd2+ (n = 6 experiments, 98 cells total for WT; n = 6 experiments, 114 cells total for YAC128, from 2 different culture batches per genotype) or 50 mm KCl + 5 μm FPL64176 (WT: open triangles; YAC128: filled triangles; n = 12 experiments per genotype, total of 216 and 211 neurons for WT and YAC128, respectively, from 5 different culture batches). Significant difference in recovery of cytosolic Ca2+, WT versus YAC128 (100 μm NMDA): two-way ANOVA; effect of genotype F(1,21) = 36.76, p < 0.0001; *p < 0.05; **p < 0.01; ***p < 0.01 by Bonferroni posttest; effect of time F(2,21) = 2.23, p > 0.05.
Figure 4.
Figure 4.
NMDA-induced changes in cytosolic Ca2+ and ΔΨm in WT and YAC128 MSNs. A, Representative mean cytosolic Ca2+ (solid line, fura-2) and mitochondrial ΔΨm (dashed line, rhodamine-123) responses of WT (top, n = 20 cells) and YAC128 (bottom, n = 15 cells) MSNs before, during, and after 5 min of application of 500 μm NMDA. Inset of YAC128 responses illustrates temporal order of changes in Ca2+ (solid line) preceding changes in ΔΨm (dashed line) during initial phase of response to NMDA (arrow indicates start of NMDA application). B, Left, Basal and peak cytosolic Ca2+ responses (F334/F380 measured using fura-2; left y-axis) to 500 μm NMDA in WT (open bars) or YAC128 (filled bars) MSNs. Not significant by paired t test; data are expressed as mean ± SEM. Right, Concurrent changes in ΔΨmF/F; right y-axis) in WT (open bar) or YAC128 (filled bar) MSNs (n = 8 paired experiments per genotype; total of 131 and 147 neurons for WT and YAC128, respectively, from 4 different culture batches). *p < 0.05 by paired t test; data are expressed as mean ± SEM. C, 5 μm CCCP-mediated mitochondrial depolarization in previously unstimulated Y128 MSNs results in very little free Ca2+ released from the mitochondria into the cytosol. Mean cytosolic Ca2+ (solid line, fura-FF) and ΔΨm (dashed line, rhodamine-123) responses of 13 MSNs. D, Representative example of mitochondrial Ca2+ uptake experiment, mean responses ± SEM of 13 WT MSNs shown. Fura-FF was used as the Ca2+ indicator. Shaded areas, determined by stimulus duration, were used in AUC calculations to determine C/N ratios.
Figure 5.
Figure 5.
Effect of mPT inhibitors on peak cytosolic Ca2+ and ΔΨm in WT and YAC128 MSNs. Intracellular calcium was monitored using fura-FF in these experiments. A, Top, Peak cytosolic Ca2+ in WT (open bars; with 10 μm CsA: n = 6 experiments, 81 neurons total; without 10 μm CsA: n = 6 experiments, 109 neurons total; from 3–4 different culture batches) and YAC128 (filled bars; with 10 μm CsA: n = 5 experiments, 106 neurons total; without 10 μm CsA: n = 7 experiments, 88 neurons total; from 3–4 different culture batches) MSNs after 5 min of application of 500 μm NMDA, with or without 10 μm CsA in all solutions (as indicated). *p < 0.05 by unpaired t test comparing treatments within genotype (see Materials and Methods); data are expressed as mean ± SEM. Bottom, Concurrent changes in ΔΨm (ΔF/F); not significant by unpaired t test, data are expressed as mean ± SEM. B, Top, Peak cytosolic Ca2+ in WT (open bars; with BkA: n = 9 experiments, 135 cells total; without BkA: n = 10 experiments, 129 cells total; from 5 different culture batches) and YAC128 (filled bars; with 5 μm BkA: n = 10 experiments, 145 cells total; without 5 μm BkA: n = 9 experiments, 148 cells total; from 5 different culture batches) MSNs after 5 min of application of 500 μm NMDA, with or without 5 μm BkA in all solutions (as indicated). Bottom, Concurrent changes in ΔΨmF/F). *p < 0.05 by unpaired t test comparing treatments within genotype (see Materials and Methods); data are expressed as mean ± SEM.
Figure 6.
Figure 6.
A general model for the main excitotoxic events in the various YAC HD models. Previous research established that enhanced NMDAR activation (step 1) leads to elevated peak cytosolic Ca2+ (step 2) and subsequent mitochondrial depolarization (step 3), caspase activation (step 4), and apoptosis (step 5) in YAC46 and YAC72 MSNs. In the YAC128 mouse model, steps 1 and 2 do not appear to play a role in the enhancement of apoptosis for YAC128 versus WT MSNs. The key excitotoxic step augmented in YAC128 MSNs occurs at the level of the mitochondria (step 3), but is still dependent on NMDAR activation. Thus, the increased sensitivity to NMDA-induced toxicity occurs at a later point in the sequence of events leading to apoptotic death in YAC128 compared with YAC72 MSNs. Delayed recovery from NMDA-induced Ca2+ loads in YAC128 MSNs may also serve to enhance calpain activity levels after intense NMDAR activity.

Similar articles

Cited by

References

    1. Abdel-Hamid KM, Baimbridge KG. The effects of artificial calcium buffers on calcium responses and glutamate-mediated excitotoxicity in cultured hippocampal neurons. Neuroscience. 1997;81:673–687. - PubMed
    1. Alano CC, Beutner G, Dirksen RT, Gross RA, Sheu SS. Mitochondrial permeability transition and calcium dynamics in striatal neurons upon intense NMDA receptor activation. J Neurochem. 80:531–538. - PubMed
    1. Banke TG, Traynelis SF. Activation of NR1/NR2B NMDA receptors. Nat Neurosci. 2003;6:144–152. - PubMed
    1. Bano D, Young KW, Guerin CJ, Lefeuvre R, Rothwell NJ, Naldini L, Rizzuto R, Carafoli E, Nicotera P. Cleavage of the plasma membrane Na+/Ca2+ exchanger in excitotoxicity. Cell. 2005;120:275–285. - PubMed
    1. Bittenbender JB, Quadfasel FA. Rigid and akinetic forms of Huntington's chorea. Arch Neurol. 1962;7:275–288. - PubMed

Publication types

MeSH terms