. 2007 Dec 12;27(50):13635-48.
doi: 10.1523/JNEUROSCI.3949-07.2007.

Insulin dysfunction induces in vivo tau hyperphosphorylation through distinct mechanisms

Affiliations

Insulin dysfunction induces in vivo tau hyperphosphorylation through distinct mechanisms

Emmanuel Planel et al. J Neurosci. .

Abstract

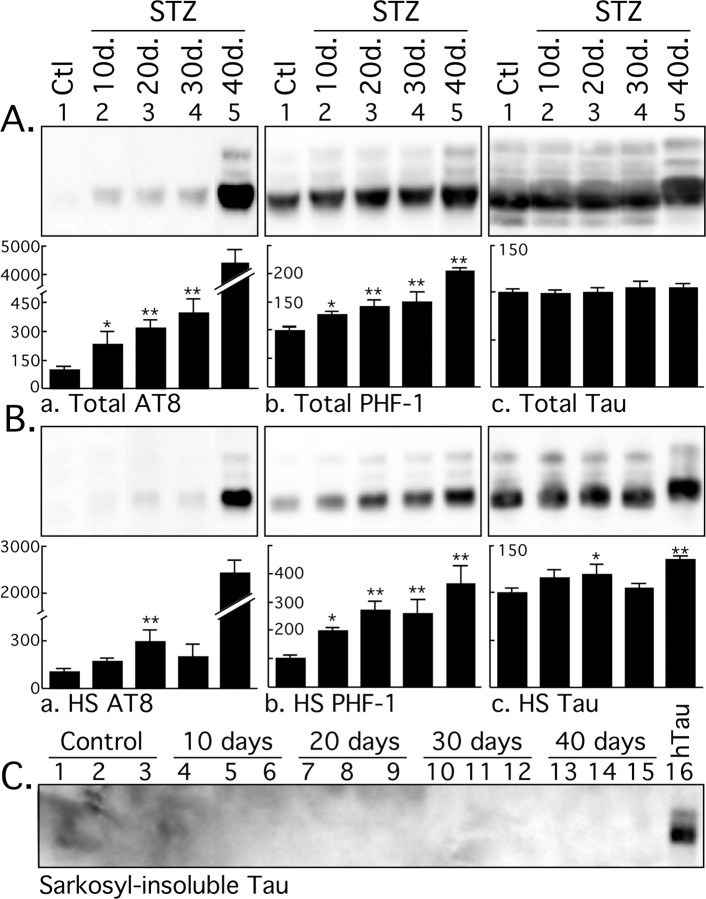
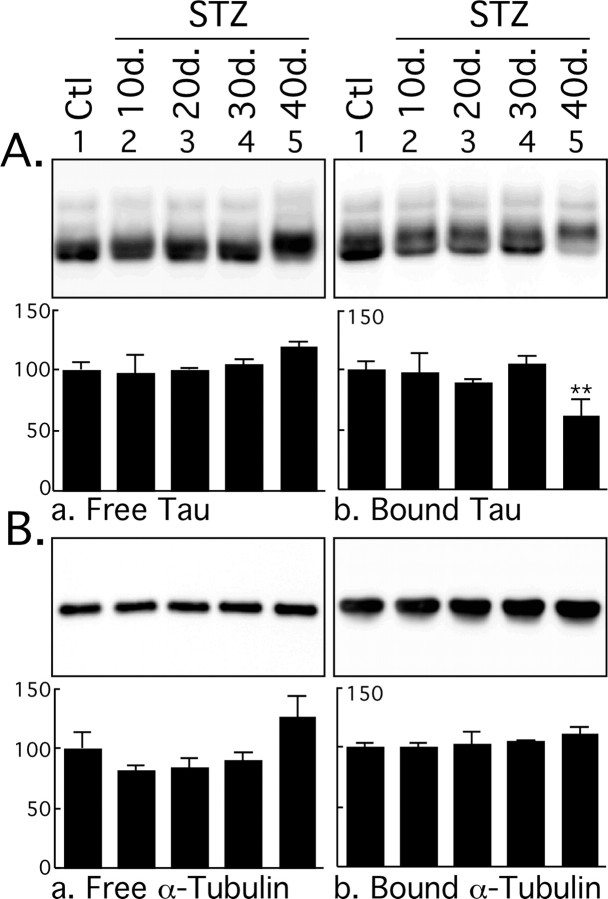
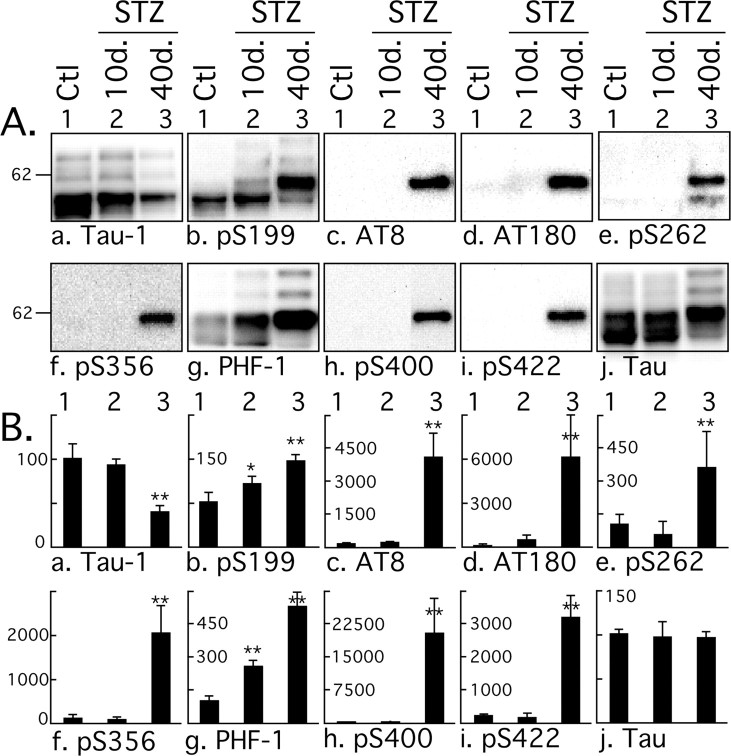
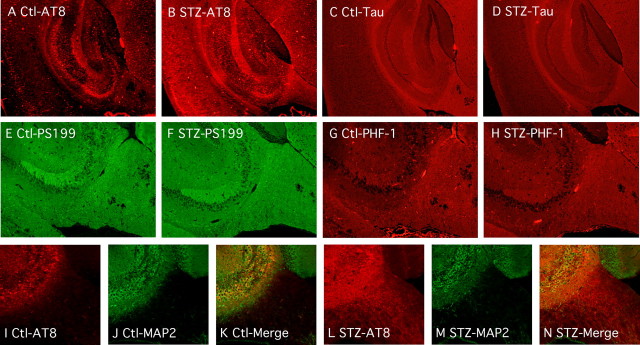
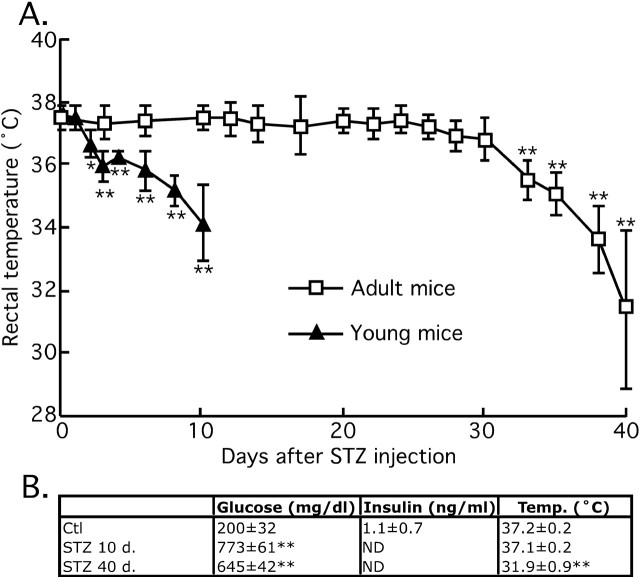
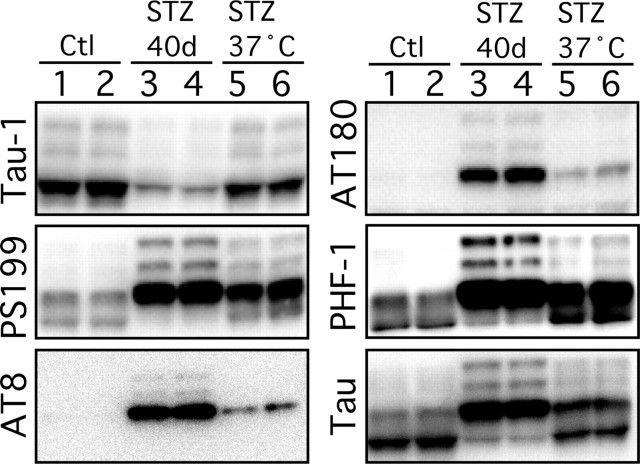
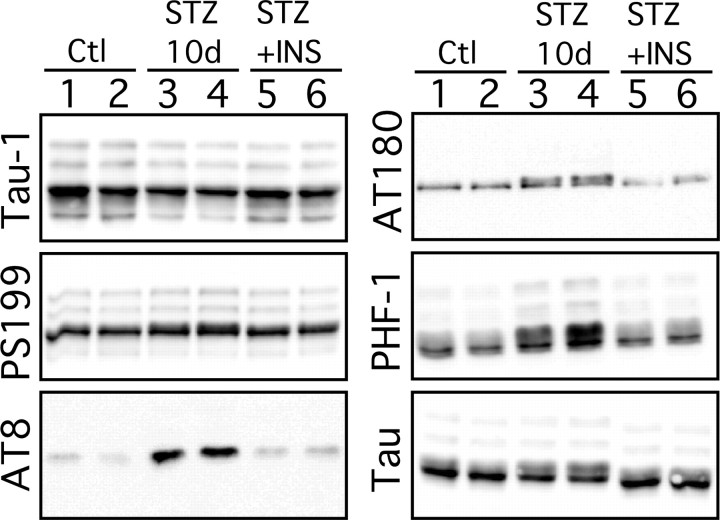
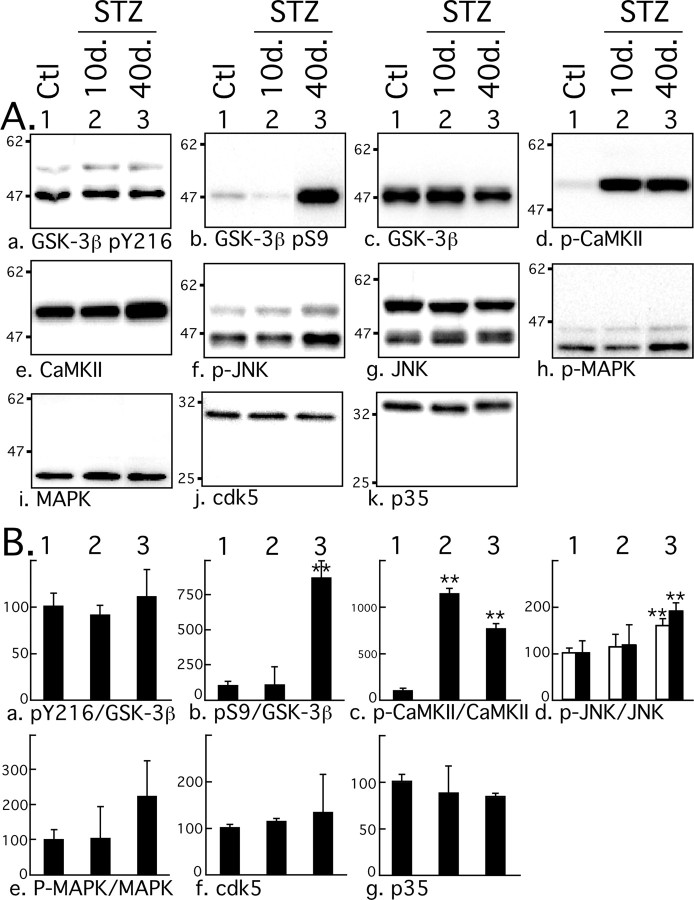
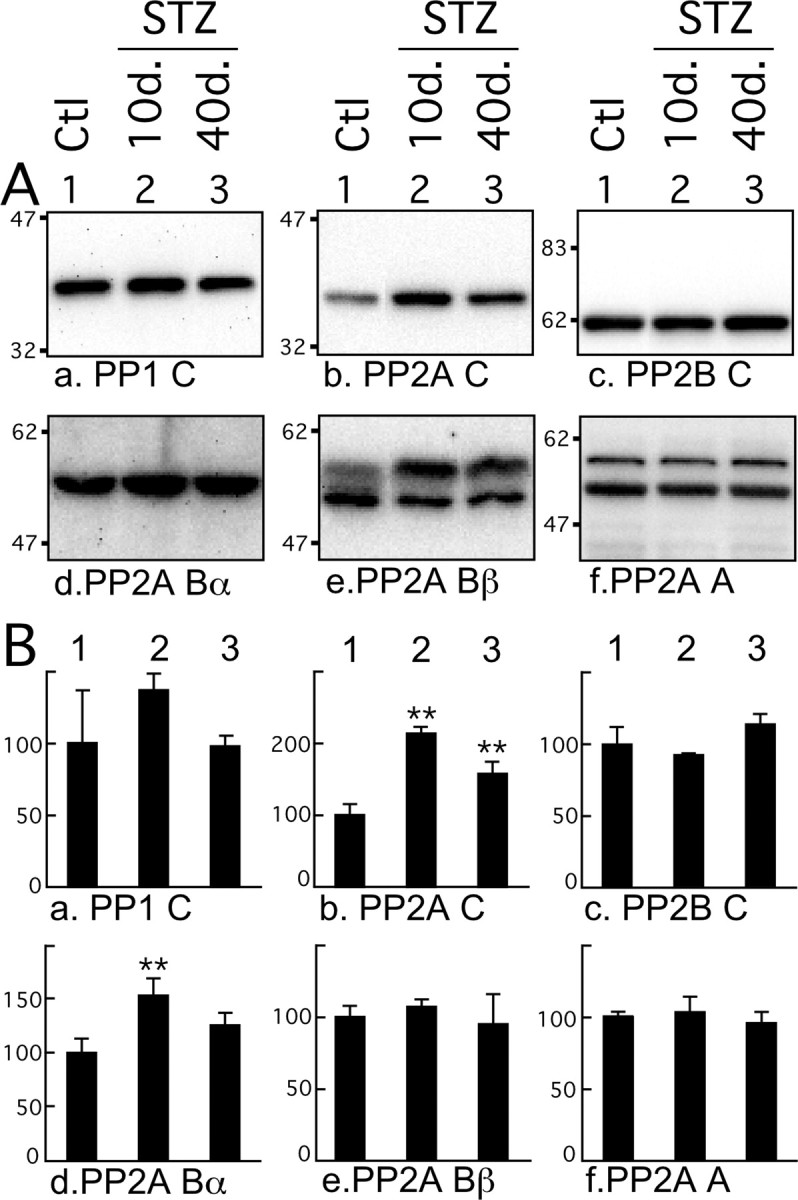
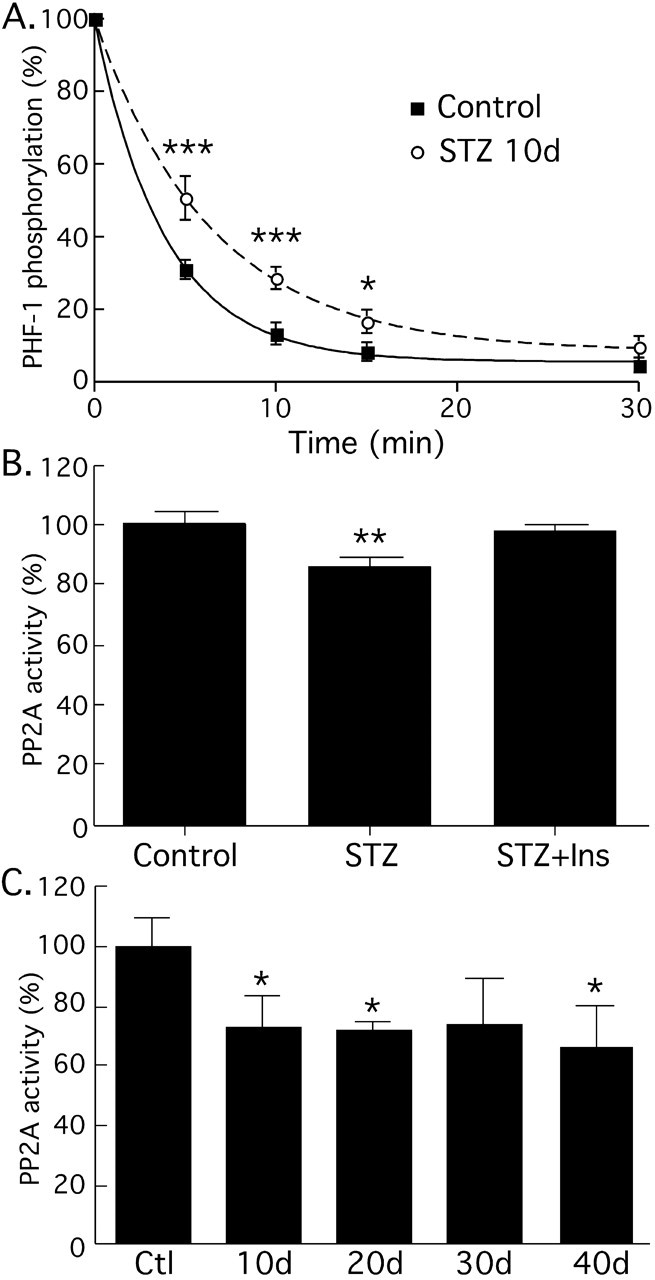
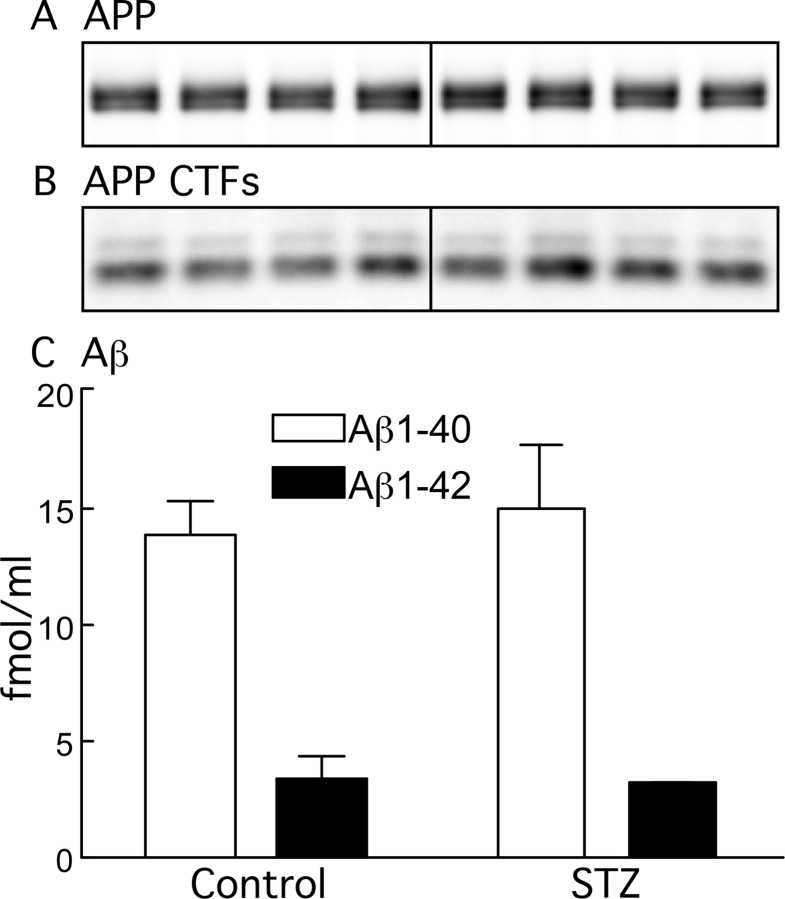
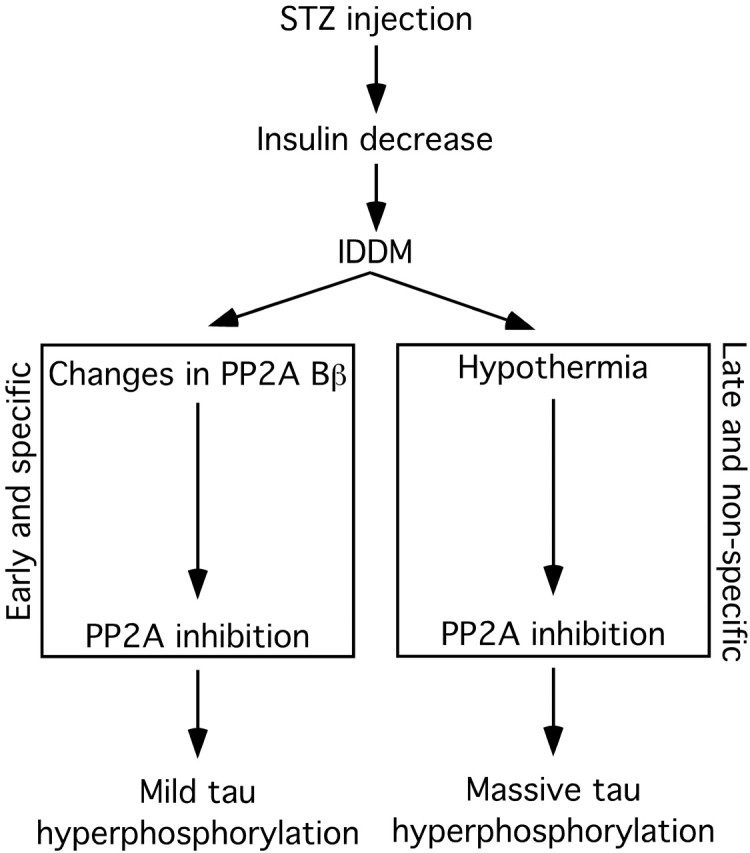
Hyperphosphorylated tau is the major component of paired helical filaments in neurofibrillary tangles found in Alzheimer's disease (AD) brains, and tau hyperphosphorylation is thought to be a critical event in the pathogenesis of the disease. The large majority of AD cases is late onset and sporadic in origin, with aging as the most important risk factor. Insulin resistance, impaired glucose tolerance, and diabetes mellitus (DM) are other common syndromes in the elderly also strongly age dependent, and there is evidence supporting a link between insulin dysfunction and AD. To investigate the possibility that insulin dysfunction might promote tau pathology, we induced insulin deficiency and caused DM in mice with streptozotocin (STZ). A mild hyperphosphorylation of tau could be detected 10, 20, and 30 d after STZ injection, and a massive hyperphosphorylation of tau was observed after 40 d. The robust hyperphosphorylation of tau was localized in the axons and neuropil, and prevented tau binding to microtubules. Neither mild nor massive tau phosphorylation induced tau aggregation. Body temperature of the STZ-treated mice did not differ from control animals during 30 d, but dropped significantly thereafter. No change in beta-amyloid (Abeta) precursor protein (APP), APP C-terminal fragments, or Abeta levels were observed in STZ-treated mice; however, cellular protein phosphatase 2A activity was significantly decreased. Together, these data indicate that insulin dysfunction induced abnormal tau hyperphosphorylation through two distinct mechanisms: one was consequent to hypothermia; the other was temperature-independent, inherent to insulin depletion, and probably caused by inhibition of phosphatase activity.


Figures

Figure 1.
Figure 1.
Immunoblot analysis of tau solubility after streptozotocin treatment. Brain proteins (hippocampus and neocortex) from control mice and mice treated for 10, 20, 30, and 40 d were extracted according to a modified method of Greenberg and Davies (1990). Tau from total brain lysates (A), heat-stable soluble (HS) (B), and Sarkosyl-insoluble fractions (C) were evaluated by immunoblot analysis with the following antibodies: AT8 (pS202/pT205), PHF-1 (pS396/pS404), and Tau (phospho-independent). The bar graphs represent the quantification of the immunoblot bands displayed above them. Each graph displays the immunoreactivity expressed as a percentage of the control (100%). The numbers in the graphs indicate the percentage of the tick line with which they are aligned. Data represented are means ± SD (n = 3 for each condition; 1 representative data displayed; each lane represents an individual mouse). The asterisks indicate significant differences from controls as follows: *p < 0.05 and **p < 0.01.
Figure 2.
Figure 2.
Microtubule binding assay of tau after streptozotocin injection. Brain proteins (hippocampus and neocortex) from control mice and mice treated for 10, 20, 30, and 40 d were extracted and incubated with taxol-stabilized microtubules. Tau and tubulin levels from MT-free and -bound fractions were evaluated by immunoblot analysis with the following antibodies: Tau (phospho-independent) (A); α-tubulin (B). The bar graphs represent the quantification of the immunoblot bands displayed above them. Each graph displays the immunoreactivity expressed as a percentage of the control (100%). The numbers in the graphs indicate the percentage of the tick line with which they are aligned. Data represented are means ± SD (n = 3 for each condition; 1 representative data displayed; each lane represents an individual mouse). The asterisks indicate significant differences from controls as follows: **p < 0.01.
Figure 3.
Figure 3.
Effect of streptozotocin on tau phosphorylation. A, Proteins from mouse hemibrain (hippocampus plus cortex) were separated by SDS-PAGE and identified with the antibodies indicated at the bottom of the boxes. For each antibody, one representative data of four for each condition (1, Ctl, control; 2, 10d., or 3, 40d., 10 or 40 d after STZ injection) are displayed in the top part of the boxes. Each lane represents an individual mouse. B, The graphs show the quantification of the bands (n = 4). The immunoreactivity is expressed as a percentage of the control treatment (100%, first column). Values in the graphs indicate the percentage of the line with which they are aligned. Data are means ± SD. The asterisks indicate significant differences as follows: *p < 0.05 and **p < 0.01.
Figure 4.
Figure 4.
Regional anatomical analysis of tau phosphorylation during anesthesia. Fluorescence photomicrographs of sagittal sections are shown. A–D, AT8 and total Tau immunostaining from control (A, C) and STZ (B, D) mice, in the hippocampus and cortical regions (40× magnification). E–H, PS199 and PHF-1 immunostaining from control (E, G) and STZ (F, H) mice, in the hippocampal region (100× magnification). I–N, AT8 (I, L), MAP2 (J, M), and merged images (K, N) from control (I–K) and STZ (L–N) mice, in the hippocampal region (100× magnification).
Figure 5.
Figure 5.
Time course of the effects of streptozotocin treatment on physiological parameters. A, Rectal temperature of 3- to 6-month-old mice (open squares; n = 18–6), and 6-week-old mice (filled triangles; n = 6). B, Plasma glucose and insulin and rectal temperature of a second set of mice (n = 4). Data are means ± SD. The asterisks indicate significant difference as follows: **p < 0.01. N.D., Nondetectable.
Figure 6.
Figure 6.
Effect of controlled temperature on tau phosphorylation during streptozotocin-induced diabetes. Proteins from mouse brain hemispheres (hippocampus plus cortex) were separated by SDS-PAGE and identified with the antibodies listed on the left of each blot. Forty days of STZ treatment (lanes 3 and 4) induced a robust tau hyperphosphorylation at all the epitopes studied when compared with controls (lanes 1 and 2). Restoring normothermia by placing the animals 1 h at 37°C only partially rescued tau hyperphosphorylation (lanes 5 and 6). Each lane represents an individual mouse. Most of represented blots were overexposed to be able to visualize tau phosphorylation in lanes 5 and 6.
Figure 7.
Figure 7.
Effect of insulin on tau phosphorylation during streptozotocin-induced diabetes. Proteins from mouse brain hemispheres (hippocampus plus cortex) were separated by SDS-PAGE and identified with the antibodies listed on the left of each blot. Ten days of STZ treatment (lanes 3 and 4) induced a slight hyperphosphorylation of tau at all the epitopes studied when compared with controls (lanes 1 and 2). Implantation of subcutaneous pumps delivering 0.75 U/d of insulin rescued tau phosphorylation to control levels (lanes 5 and 6). Each lane represents an individual mouse. INS, Insulin.
Figure 8.
Figure 8.
Effect of streptozotocin on tau kinases activation. A, Proteins from mouse brain hemispheres (hippocampus plus cortex) were separated by SDS-PAGE and identified with the antibodies indicated at the bottom of the boxes. For each antibody, one representative data of four for each condition (1, Ctl, control; 2, 10d., or 3, 40d., 10 or 40 d after STZ injection) are displayed in the top part of the boxes. Each lane represents an individual mouse. B, The graphs show the quantification of the bands (n = 4). For graphs a–e, the level of phospho-kinase is normalized to the level of total kinase. For JNK (f, g), p46 (open columns) and p54 (filled columns) were quantified separately. The immunoreactivity is expressed as a percentage of the control treatment (100%, first column). The numbers in the graphs indicate the percentage of the line with which they are aligned. Data are means ± SD. The asterisks indicate significant differences as follows: *p < 0.05 and **p < 0.01.
Figure 9.
Figure 9.
Effect of streptozotocin on phosphatases levels. A, Proteins from mouse brain hemispheres (hippocampus plus cortex) were separated by SDS-PAGE and identified with the antibodies indicated at the bottom of the boxes. PP1 C, PP2A C, and PP2B C detect the catalytic subunits of PP1, PP2A, and PP2B, respectively. PP2A Bα and Bβ detect Bα and Bβ regulatory subunits of PP2A, and PP2A A detects anchoring subunits. For each antibody, one representative data of four for each condition (1, Ctl, control; 2, 10d., or 3, 40d., 10 or 40 d after STZ injection) are displayed in the top part of the boxes. Each lane represents an individual mouse. B, The graphs show the quantification of the bands (n = 4). The immunoreactivity is expressed as a percentage of the control treatment (100%, first column). The numbers in the graphs indicate the percentage of the line with which they are aligned. Data are means ± SD. The asterisks indicate significant differences as follows: *p < 0.05 and **p < 0.01.
Figure 10.
Figure 10.
Effect of streptozotocin treatment on phosphatase activity. A, Phosphatase activity was evaluated by endogenous tau dephosphorylation followed by Western blot analysis (n = 3). Tau from control brains (solid squares, solid line) was dephosphorylated faster than tau from animals treated with STZ after 10 d (solid circles, dotted line). B, To confirm this result, PP2A activity was evaluated with the PP2A Assay System from Promega. Similarly to the endogenous assay, PP2A activity was inhibited in 10 d STZ-treated mice (n = 3). Implantation of subcutaneous pumps delivering 0.75 U/d insulin in STZ-treated mice restored PP2A activity to control levels. C, Immunoprecipitation assay of PP2A after STZ treatment. PP2A presented similar level of inhibition at 10, 20, 30, and 40 d after injection. Data are means ± SD. The asterisks indicate significant differences as follows: *p < 0.05, **p < 0.01, and ***p < 0.001.
Figure 11.
Figure 11.
Effect of streptozotocin on APP metabolism. Proteins from mouse brain hemispheres (hippocampus plus cortex) of control and 10 d STZ-treated mice were separated by SDS-PAGE and identified with C1/6.1 antibody, which recognize APP (A) and CTFs (B). C shows the levels of Aβ1–40 (open bars) and Aβ1–42 (filled bars) for control and STZ 10 d, as detected by ELISA (n = 4). Data are means ± SD.
Figure 12.
Figure 12.
Putative mechanism of tau hyperphosphorylation during insulin dysfunction. Injection of STZ induces immediate decrease of pancreatic insulin secretion and results in insulin-dependent diabetes mellitus. During the early phase of DM, when the adult mice are still normothermic, PP2A is inhibited, presumably through changes in the Bβ regulatory subunit, which leads to a mild hyperphosphorylation of tau specific to insulin deficiency, as demonstrated in Figures 7 and 10. In the later phase of DM, deficits in peripheral glucose/energy metabolism lead to hypothermia. This leads to a direct inhibition of PP2A activity by low temperatures, resulting in massive hyperphosphorylation of tau not specific to hypoinsulinemia. The early and mild tau hyperphosphorylation is still present at this stage, but is masked by the effects of hypothermia, as demonstrated in Figure 6.

Similar articles

Cited by

References

    1. Alonso AC, Zaidi T, Grundke-Iqbal I, Iqbal K. Role of abnormally phosphorylated tau in the breakdown of microtubules in Alzheimer disease. Proc Natl Acad Sci USA. 1994;91:5562–5566. - PMC - PubMed
    1. Alonso AC, Zaidi T, Novak M, Grundke-Iqbal I, Iqbal K. Hyperphosphorylation induces self-assembly of tau into tangles of paired helical filaments/straight filaments. Proc Natl Acad Sci USA. 2001;98:6923–6928. - PMC - PubMed
    1. Alonso AC, Mederlyova A, Novak M, Grundke-Iqbal I, Iqbal K. Promotion of hyperphosphorylation by frontotemporal dementia tau mutations. J Biol Chem. 2004;279:34873–34881. - PubMed
    1. Andorfer C, Kress Y, Espinoza M, de Silva R, Tucker KL, Barde YA, Duff K, Davies P. Hyperphosphorylation and aggregation of tau in mice expressing normal human tau isoforms. J Neurochem. 2003;86:582–590. - PubMed
    1. Arvanitakis Z, Wilson RS, Bienias JL, Evans DA, Bennett DA. Diabetes mellitus and risk of Alzheimer disease and decline in cognitive function. Arch Neurol. 2004;61:661–666. - PubMed

Publication types

MeSH terms