. 2007 Dec 12;27(50):13649-54.
doi: 10.1523/JNEUROSCI.3153-07.2007.

NR2A-/- mice lack long-term potentiation but retain NMDA receptor and L-type Ca2+ channel-dependent long-term depression in the juvenile superior colliculus

Affiliations

NR2A-/- mice lack long-term potentiation but retain NMDA receptor and L-type Ca2+ channel-dependent long-term depression in the juvenile superior colliculus

Jian-Ping Zhao et al. J Neurosci. .

Abstract

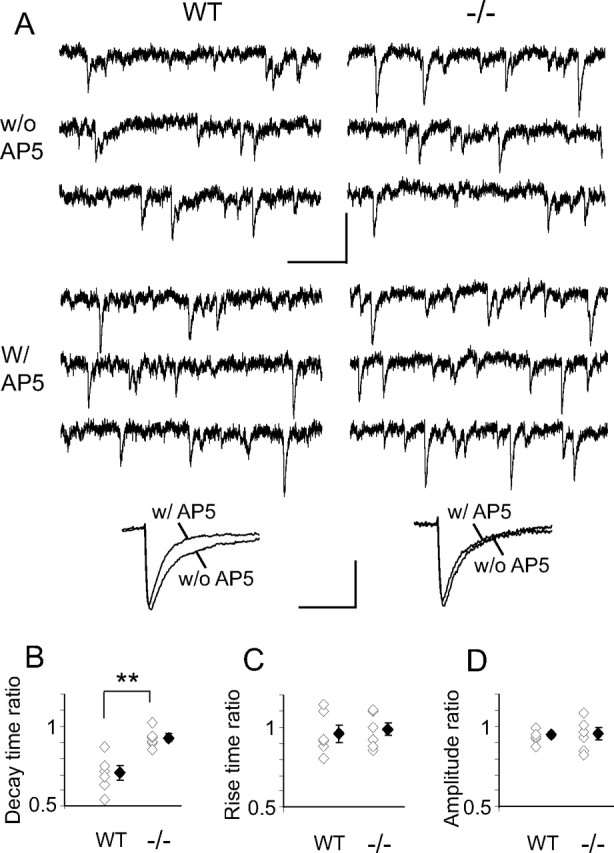
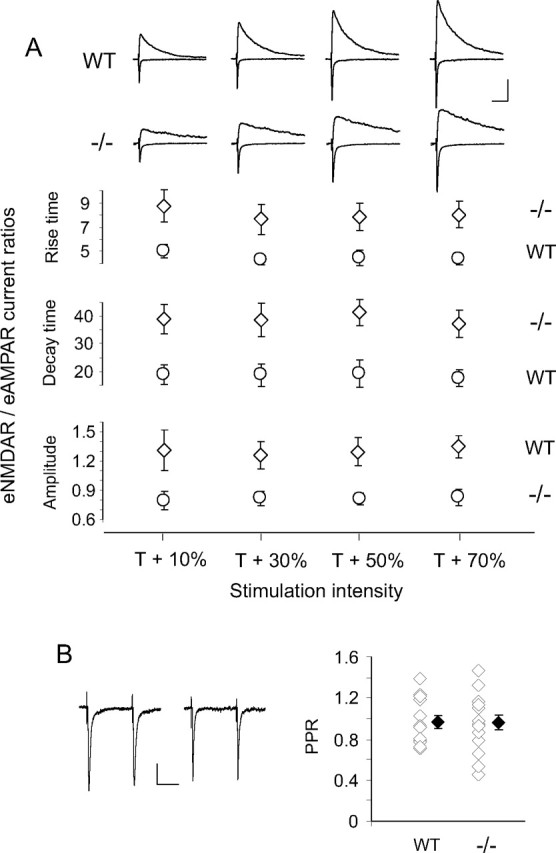
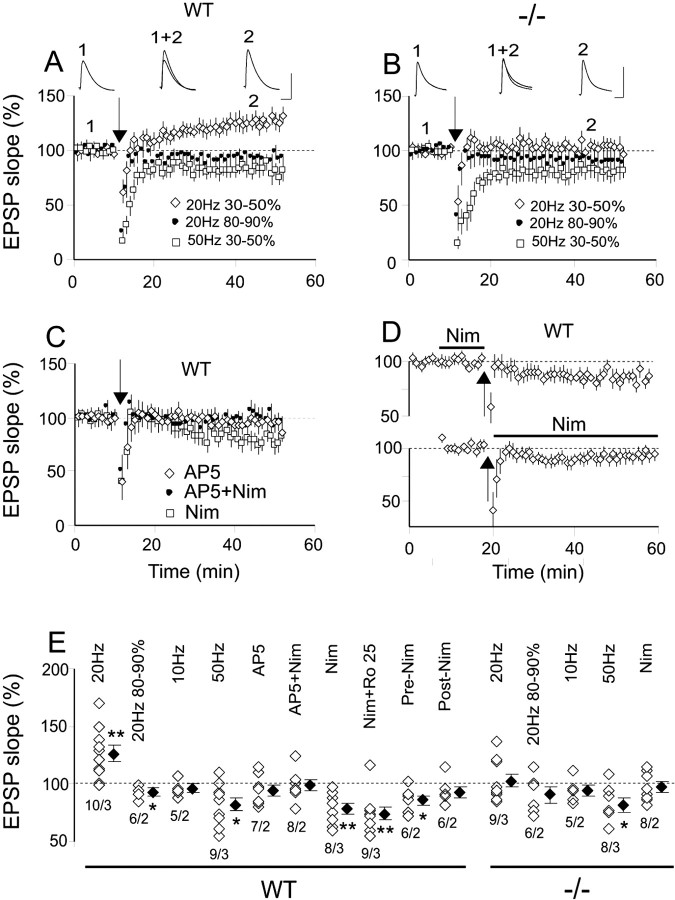
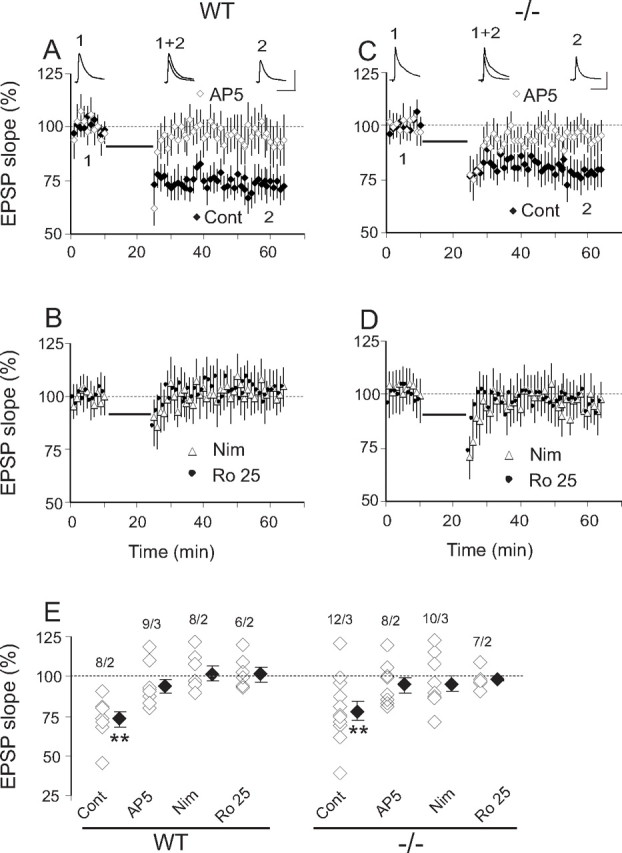
Whether the subunit composition of NMDA receptors (NMDARs) controls the direction of long-term plasticity is currently disputed. In the visual layers of NR2A-/- juvenile superior colliculus (SC), synapses lose miniature NMDAR currents, leaving NR2B-rich receptors in extrasynaptic regions. Compared with wild type (WT), evoked NMDAR currents in mutant neurons have slower rise and decay times and lower NMDAR/AMPAR current ratios. Moreover, NMDAR and L-type Ca2+ channel-dependent SC long-term potentiation (LTP) is absent in NR2A-/- cells, whereas both WT and mutant neurons show long-duration, low-frequency-induced, long-term depression (LLF-LTD) that is blocked by either AP-5, nimodipine, or Ro 25-6981 [R-(R,S)-alpha-(4-hydroxyphenyl)-beta-methyl-4-(phenylmethyl)-1-piperidine propranol]. Thus, NMDAR currents or signaling localized at the postsynaptic density are essential to SC NMDAR-dependent LTP, whereas extrasynaptic or NR2B-rich NMDARs are necessary for LLF-LTD. However, synaptic NMDARs as well as the NR2A subunit are missing in NR2A-/- mice. Therefore, NR2 subunit-specific ligand binding/channel properties and/or separate signaling pathways interacting with NMDARs at synaptic versus extrasynaptic receptors could underlie these results.


Figures

Figure 1.
Figure 1.
AP-5 shortens mEPSC decay time in WT but not in NR2A−/− SC neurons. A, Top, Sample traces of mEPSCs recorded in Mg2+-free ACSF at −70 mV from WT and NR2A−/− SC in the absence (w/o AP5) and presence (w/AP5) of AP-5. Calibration: 20 pA, 100 ms. Bottom, Representative averaged traces of mEPSCs before and 5 min after AP-5 application in a WT (538 and 453 events, respectively) and a NR2A−/− (627 and 725 events, respectively) neuron. Calibration: 5 pA, 13 ms. B–D, Summary plots showing ratios for each cell alongside averaged mEPSC decay time, rise time, and amplitude ratios (averaged mEPSC with AP-5, averaged mEPSC without AP-5; n = 6 and 2 for each genotype). White diamonds represent individual experiments, and black diamonds are means of all the experiments in that group. B, In WT cells, the decay time ratio is significantly lower than that in NR2A−/− cells (WT, 0.71 ± 0.05; NR2A−/−, 0.93 ± 0.02; p = 0.001). There is no difference between WT and NR2A−/− neurons in rise time ratio (C) (WT, 0.96 ± 0.06; NR2A−/−, 0.98 ± 0.04; p = 0.69) or amplitude ratio (D) (WT, 0.94 ± 0.02; NR2A−/−, 0.95 ± 0.04; p = 0.82). Unpaired two-tail Student's t test.
Figure 2.
Figure 2.
WT and NR2A−/− SC neurons show different NMDAR/AMPAR evoked current ratios but similar presynaptic release probabilities. A, Top, Sample average recordings of eAMPARcs at −70 mV and eNMDARcs at +40 mV in WT and NR2A−/− SC neurons over a range of stimulation intensities. Each average is of 10 evoked currents. Calibration: 50 pA, 100 ms. Bottom, Summary plots showing averaged eNMDARc/eAMPARc ratios for rise time, decay time, and amplitude (n = 6 and 2 for each genotype). Genotype had a significant effect on rise time ratio (F = 3.7, df = 7, p < 0.0001), decay time ratio (F = 5.7, df = 7, p < 0.0001), and amplitude ratio (F = 4.9, df = 7, p < 0.0001). NR2A−/− neurons had higher rise time and decay time ratios and lower amplitude ratios than WT neurons. Stimulus intensity had no effect (p > 0.05) on any ratio, and there was no significant interaction between stimulus intensity and genotype (p > 0.05) (two-factor ANOVA). B, PPR sample traces (left; calibration: 20 pA, 50 ms) and summary graph (right) showing no difference between WT and NR2A−/− neurons (WT, 0.95 ± 0.06, n = 14 and 3; NR2A−/−, 0.95 ± 0.07, n = 14 and 3; p = 0.97). Each sample trace is the average of 10 paired-pulse responses. T, Threshold. White diamonds represent individual experiments, and black diamonds are means of all the experiments in that group.
Figure 3.
Figure 3.
NMDAR and L-type Ca2+ channel-dependent LTP is present in WT but not in NR2A−/− SC neurons. A, E, In WT SC, only 20 Hz at 30–50% ST induced LTP (126.5 ± 6.9, n = 10 and 3, p = 0.004), 20 Hz at 80–90% ST produced a small but significant depression (92.2 ± 2.1, n = 6 and 2, p = 0.01), 10 Hz at 30–50% ST produced no change from baseline (95.4 ± 3.1, n = 5 and 2, p = 0.2), and 50 Hz at 30–50% produced a significant LTD (82.3 ± 5.6, n = 9 and 3, p = 0.02). Sample traces are averages of 30 evoked EPSPs obtained during the 10 min of baseline (1) and 30–40 min after induction (2) with 20 Hz at 30–50% ST (calibration: 10 mV, 50 ms). For all parts of Figure 3, stimulus intensity is given as percentage of ST identified as percentage alone, and all stimuli are 20 s in duration. EPSP slope is given as percentage change from baseline (average evoked EPSC during 10 min baseline over average EPSP slope 30–40 min after induction). B, E, In NR2A−/− SC, four of five stimulation protocols produced no significant change from baseline (20 Hz at 30–50% ST, 102.7 ± 5.9, n = 9 and 3, p = 0.68; 20 Hz at 80–90% ST, 90.1 ± 6.7, n = 6 and 2, p = 0.22; 10 Hz at 30–50% ST, 94.7 ± 4.5, n = 5 and 2, p = 0.35; and 20 Hz 30–50% ST in the presence of Nim, 97 ± 4.6, n = 8 and 2, p = 0.51). The exception was 50 Hz at 30–50% ST, which produced an LTD (81.1 ± 6.1, n = 8 and 3, p = 0.02) similar to that seen with 50 Hz stimulation in WT. Sample traces are averages of 30 evoked EPSPs obtained during the 10 min of baseline (1) and 30–40 min after induction (2) with 20 Hz at 30–50% ST (calibration bar: 10 mV, 50 ms). C, E, In WT neurons, LTP induction with 20 Hz at 30–50% was prevented by AP-5 alone (94.9 ± 4.8, n = 7 and 2, p = 0.36) or AP-5 plus Nim (98.9 ± 4.8, n = 8 and 2, p = 0.81) and reversed to LTD by Nim alone (78.7 ± 5, n = 8 and 3, p < 0.01) or Nim plus Ro 25 (74.4 ± 5.6, n = 9 and 3, p < 0.01). D, Top, In WT neurons, LTP induction with 20 Hz at 30–50% ST could be reversed to LTD by Nim use before induction (85.7 ± 4.1, n = 6 and 2, p = 0.02). Bottom, All plasticity was prevented by Nim application after induction (92.1 ± 4.6, n = 6 and 2, p = 0.18). E, Summary of mean EPSP slope changes from baseline at 30–40 min after induction under the different conditions in WT and NR2A−/− SC neurons. Each open diamond represents an individual experiment, and filled diamonds are the means of all the experiments in that group. All stimuli are at 30–50% ST except when noted. All stimulation frequencies are 20 Hz unless otherwise stated, and all stimulation durations are 20 s. Pre-Nim and Post-Nim, Before and after induction application of Nimodipine. Paired-sample, two-tailed Student's t test.
Figure 4.
Figure 4.
NMDAR and L-type Ca2+ channel-dependent LTD (LLF-LTD) is present in both WT and NR2A−/− mouse SC neurons and requires NR2B. A, B, In WT SC, 900 stimuli at 1 Hz (LLF stimulation, thick line) induced significant LLF-LTD (Cont; 72.9 ± 4.9, n = 8 and 2, p < 0.01) that was blocked by AP-5, (94.2 ± 4.4, n = 9 and 3, p = 0.26), Nim (101.2 ± 5.1, n = 8 and 2, p = 0.71), or Ro 25 (102.8 ± 4.5, n = 6 and 2, p = 0.53). C, D, NR2A−/− SC neurons show responses similar to WT with LLF stimulation. LLF-LTD (Cont; 77.9 ± 6, n = 12 and 3, p < 0.01) was blocked by AP-5 (94.4 ± 4.7, n = 8 and 2, p = 0.34), Nim (95.2 ± 4.6, n = 10 and 3, p = 0.35), or Ro 25 (97.3 ± 2, n = 7 and 2, p = 0.28). WT versus NR2A−/− LLF-LTD was not significantly different (p = 0.58). Sample traces represent averages of 30 EPSPs obtained during the 10 min of base line (1) and 30–40 min after 900 stimuli at 1 Hz induction (2) in WT and NR2A−/− neurons (calibration: 10 mV, 50 ms). E, Summary of mean EPSP slope changes in WT and NR2A−/− neurons under the different pharmacological conditions. Format as in Figure 3E (paired-sample, two-tailed Student's t test). White diamonds represent individual experiments, and black diamonds are means of all the experiments in that group.

References

    1. Barria A, Malinow R. NMDA receptor subunit composition controls synaptic plasticity by regulating binding to CaMKII. Neuron. 2005;48:289–301. - PubMed
    1. Berberich S, Punnakkal P, Jensen V, Pawlak V, Seeburg PH, Hvalby O, Kohr G. Lack of NMDA receptor subtype selectivity for hippocampal long-term potentiation. J Neurosci. 2005;25:6907–6910. - PMC - PubMed
    1. Cavus I, Teyler T. Two forms of long-term potentiation in area CA1 activate different signal transduction cascades. J Neurophysiol. 1996;76:3038–3047. - PubMed
    1. Chen S, Diamond JS. Synaptically released glutamate activates extrasynaptic NMDA receptors on cells in the ganglion cell layer of rat retina. J Neurosci. 2002;22:2165–2173. - PMC - PubMed
    1. Clark BA, Cull-Candy SG. Activity-dependent recruitment of extrasynaptic NMDA receptor activation at an AMPA receptor-only synapse. J Neurosci. 2002;22:4428–4436. - PMC - PubMed

Publication types

MeSH terms