

Order-dependent modulation of directional signals in the supplementary and presupplementary motor areas
- PMID: 18077677
- PMCID: PMC2397443
- DOI: 10.1523/JNEUROSCI.2982-07.2007
Order-dependent modulation of directional signals in the supplementary and presupplementary motor areas
Abstract
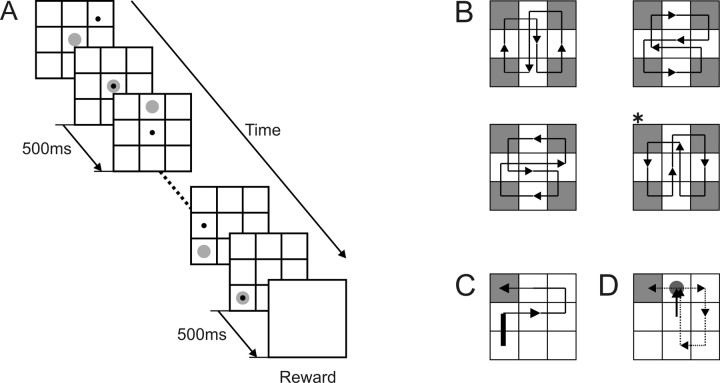
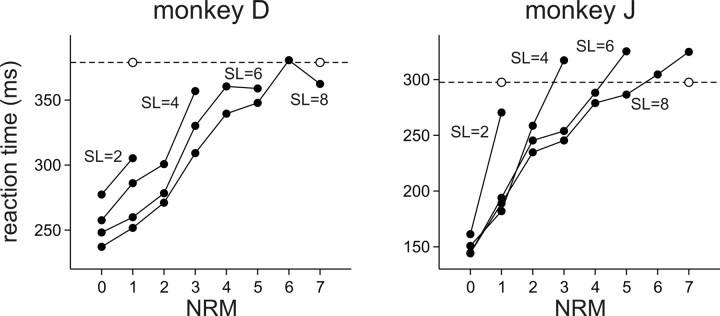
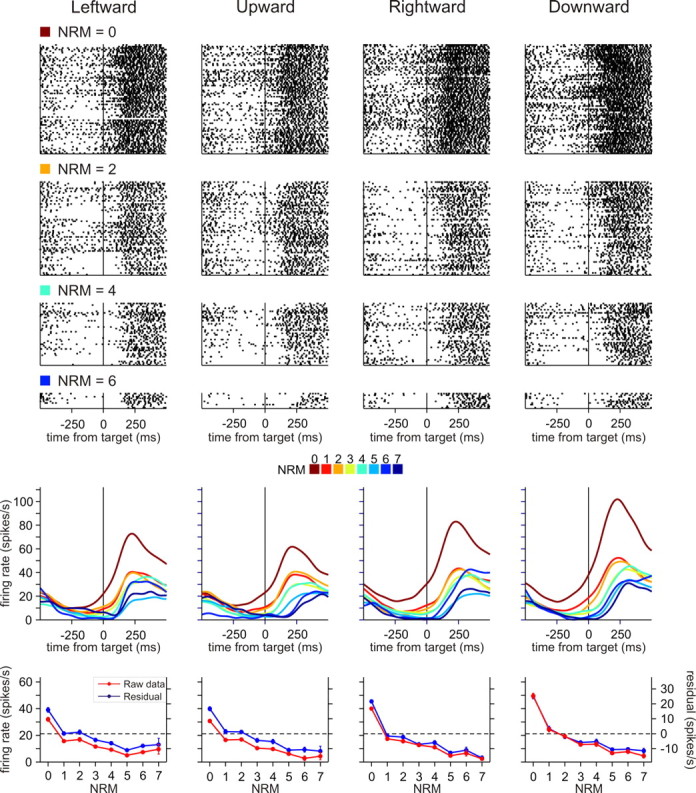
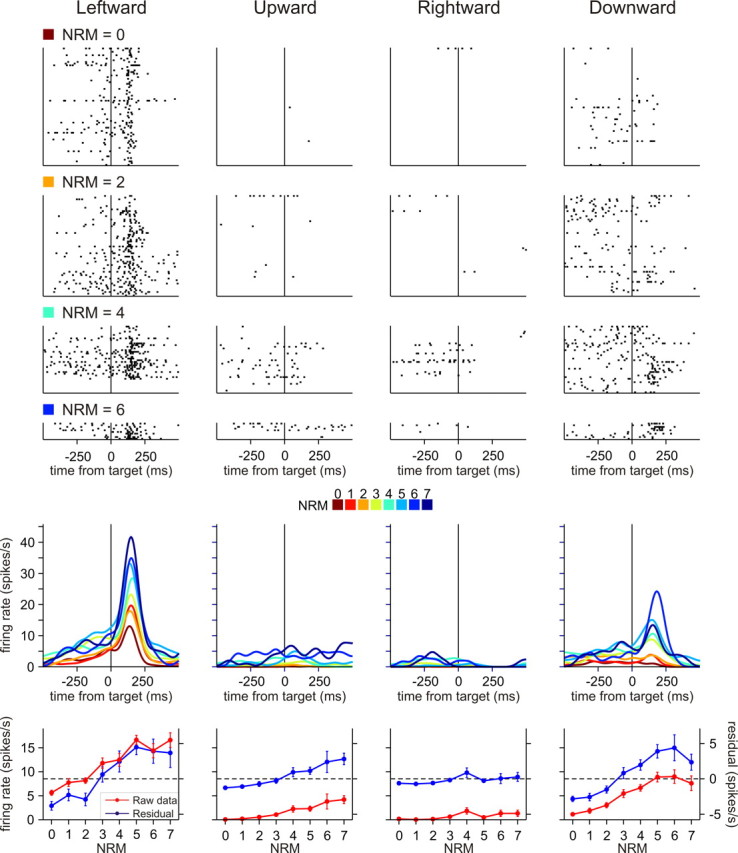
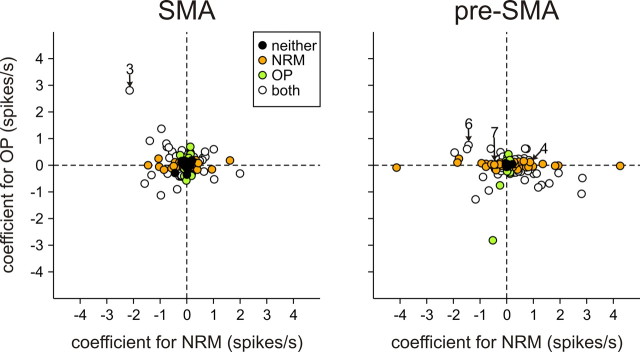
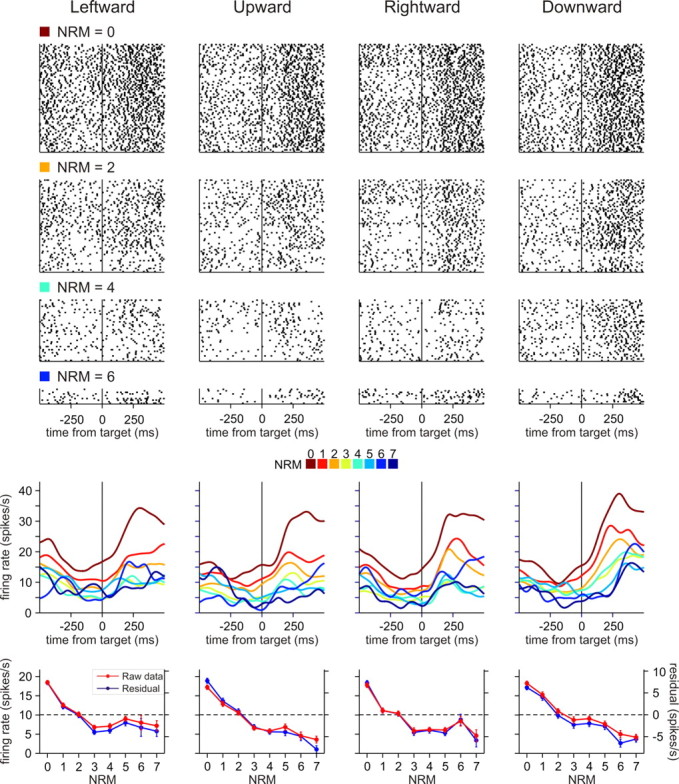
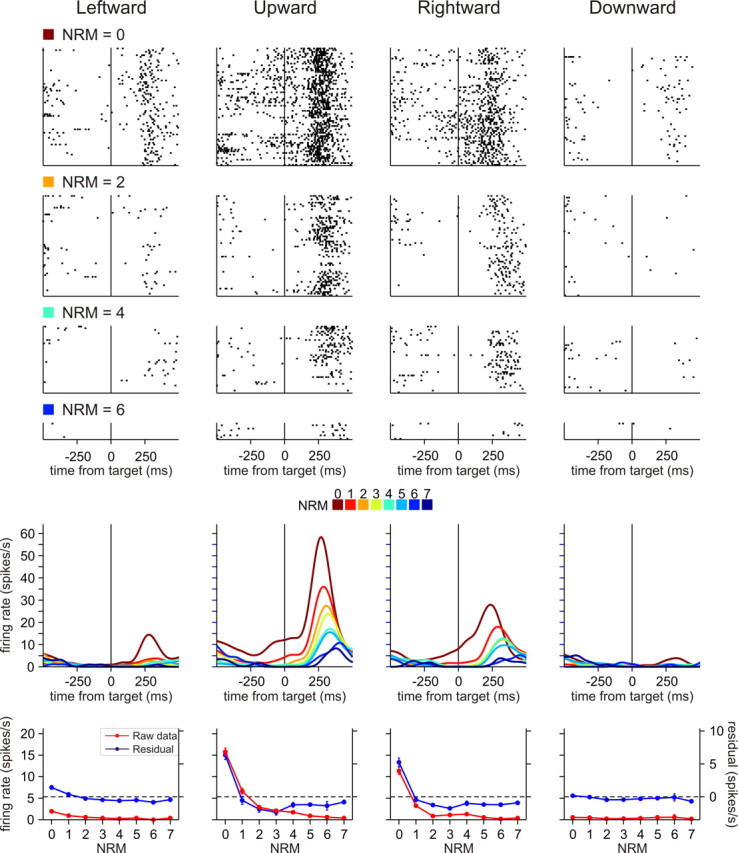
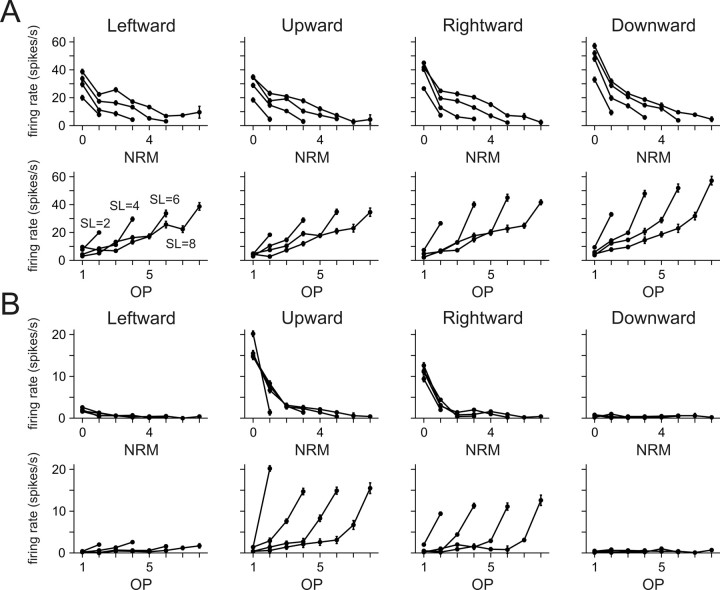
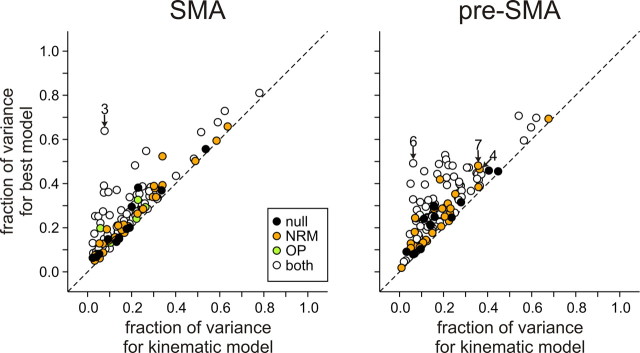
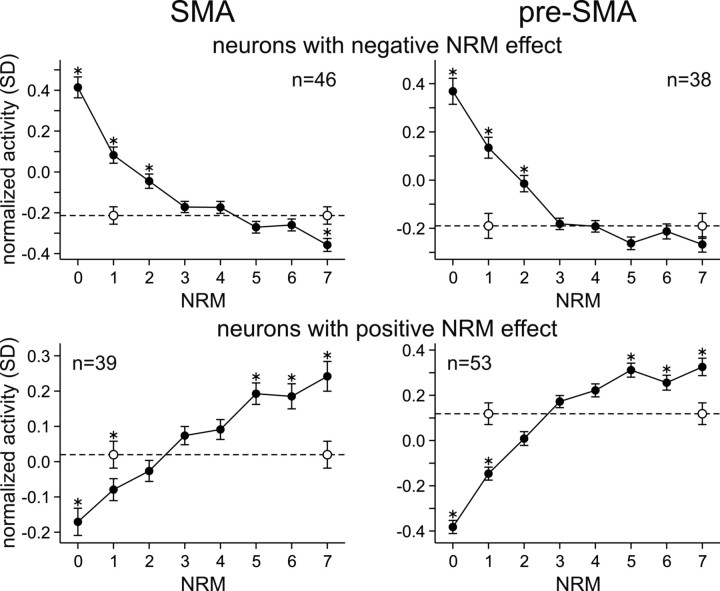
To maximize reward and minimize effort, animals must often execute multiple movements in a timely and orderly manner. Such movement sequences must be usually discovered through experience, and during this process, signals related to the animal's action, its ordinal position in the sequence, and subsequent reward need to be properly integrated. To investigate the role of the primate medial frontal cortex in planning and controlling multiple movements, monkeys were trained to produce a series of hand movements instructed by visual stimuli. We manipulated the number of movements in a sequence across trials, making it possible to dissociate the effects of the ordinal position of a given movement and the number of remaining movements necessary to obtain reward. Neurons in the supplementary and presupplementary motor areas modulated their activity according to the number of remaining movements, more often than in relation to the ordinal position, suggesting that they might encode signals related to the timing of reward or its temporally discounted value. In both cortical areas, signals related to the number of remaining movements and those related to movement direction were often combined multiplicatively, suggesting that the gain of the signals related to movements might be modulated by motivational factors. Finally, compared with the supplementary motor area, neurons in the presupplementary motor area were more likely to increase their activity when the number of remaining movements is large. These results suggest that these two areas might play complementary roles in controlling movement sequences.
Figures
Similar articles
-
Behavioral context and coherent oscillations in the supplementary motor area.J Neurosci. 2004 May 5;24(18):4453-9. doi: 10.1523/JNEUROSCI.0047-04.2004. J Neurosci. 2004. PMID: 15128859 Free PMC article.
-
Relation of ordinal position signals to the expectation of reward and passage of time in four areas of the macaque frontal cortex.J Neurophysiol. 2011 May;105(5):2547-59. doi: 10.1152/jn.00903.2010. Epub 2011 Mar 9. J Neurophysiol. 2011. PMID: 21389312 Free PMC article.
-
Changing directions of forthcoming arm movements: neuronal activity in the presupplementary and supplementary motor area of monkey cerebral cortex.J Neurophysiol. 1996 Oct;76(4):2327-42. doi: 10.1152/jn.1996.76.4.2327. J Neurophysiol. 1996. PMID: 8899607
-
Parieto-frontal coding of reaching: an integrated framework.Exp Brain Res. 1999 Dec;129(3):325-46. doi: 10.1007/s002210050902. Exp Brain Res. 1999. PMID: 10591906 Review.
-
Towards a computational neuropsychology of action.Prog Brain Res. 2007;165:383-94. doi: 10.1016/S0079-6123(06)65024-3. Prog Brain Res. 2007. PMID: 17925259 Free PMC article. Review.
Cited by
-
Disrupted functional connectivity in primary progressive apraxia of speech.Neuroimage Clin. 2018 Mar 3;18:617-629. doi: 10.1016/j.nicl.2018.02.036. eCollection 2018. Neuroimage Clin. 2018. PMID: 29845010 Free PMC article.
-
Decision making: from neuroscience to psychiatry.Neuron. 2013 Apr 24;78(2):233-48. doi: 10.1016/j.neuron.2013.04.008. Neuron. 2013. PMID: 23622061 Free PMC article. Review.
-
Primate amygdala neurons evaluate the progress of self-defined economic choice sequences.Elife. 2016 Oct 12;5:e18731. doi: 10.7554/eLife.18731. Elife. 2016. PMID: 27731795 Free PMC article.
-
The amygdala and the pursuit of future rewards.Front Neurosci. 2025 Jan 22;18:1517231. doi: 10.3389/fnins.2024.1517231. eCollection 2024. Front Neurosci. 2025. PMID: 39911407 Free PMC article. Review.
-
Distributed coding of actual and hypothetical outcomes in the orbital and dorsolateral prefrontal cortex.Neuron. 2011 May 26;70(4):731-41. doi: 10.1016/j.neuron.2011.03.026. Neuron. 2011. PMID: 21609828 Free PMC article.
References
-
- Andersen RA, Snyder LH, Bradley DC, Xing J. Multimodal representation of space in the posterior parietal cortex and its use in planning movements. Annu Rev Neurosci. 1997;20:303–330. - PubMed
-
- Averbeck BB, Lee D. Coding and transmission of information by neural ensembles. Trends Neurosci. 2004;27:225–230. - PubMed
Publication types
MeSH terms
Grants and funding
LinkOut - more resources
Full Text Sources