. 2007 Dec 12;27(50):13691-700.
doi: 10.1523/JNEUROSCI.3910-07.2007.

Synaptic vesicle mobility in mouse motor nerve terminals with and without synapsin

Affiliations

Synaptic vesicle mobility in mouse motor nerve terminals with and without synapsin

Michael A Gaffield et al. J Neurosci. .

Abstract

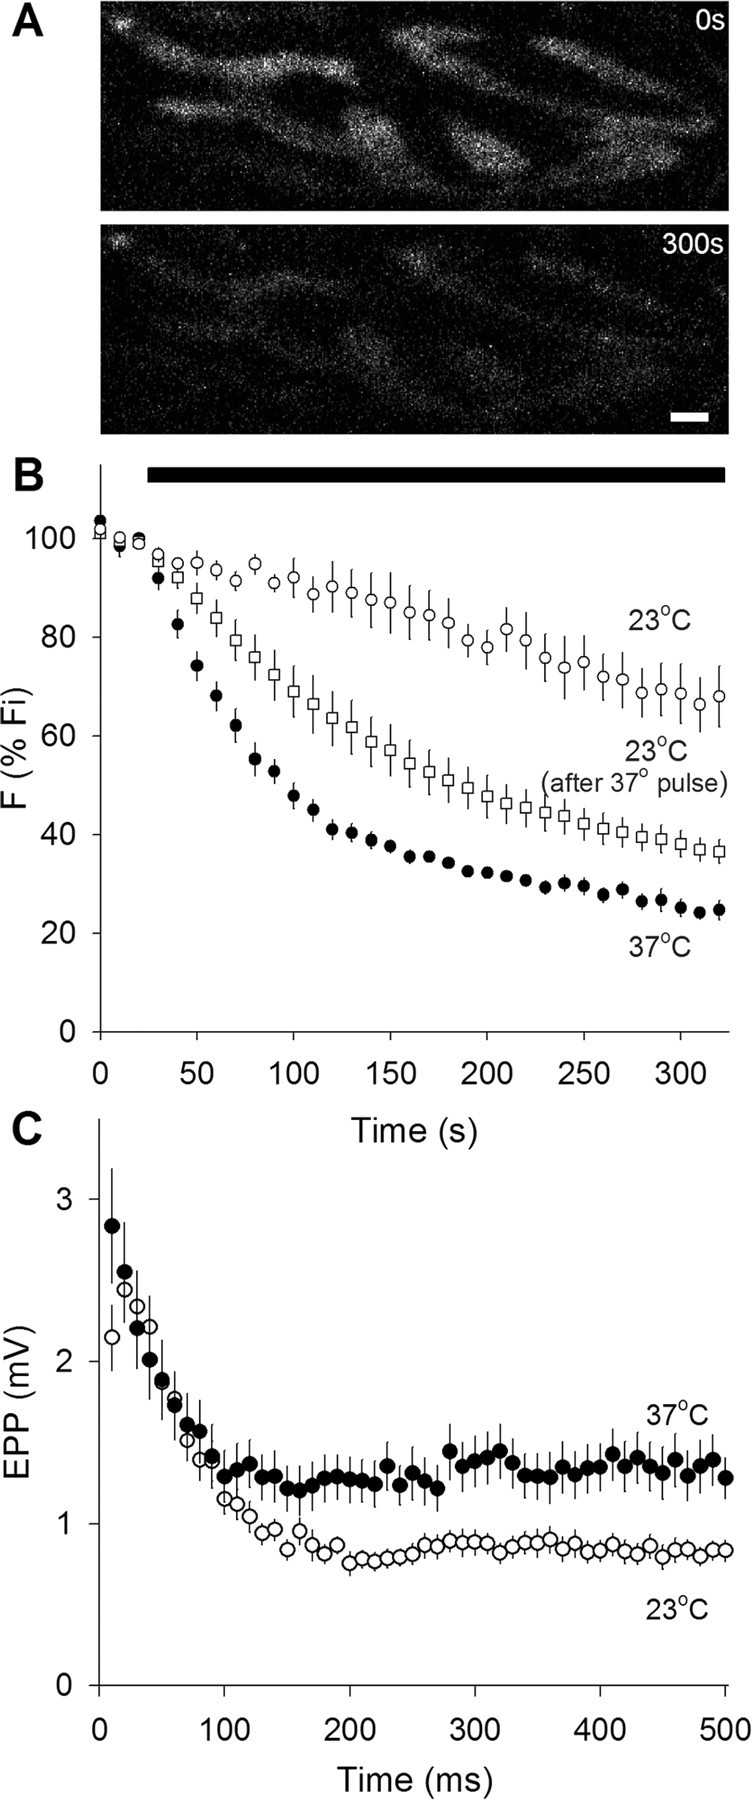
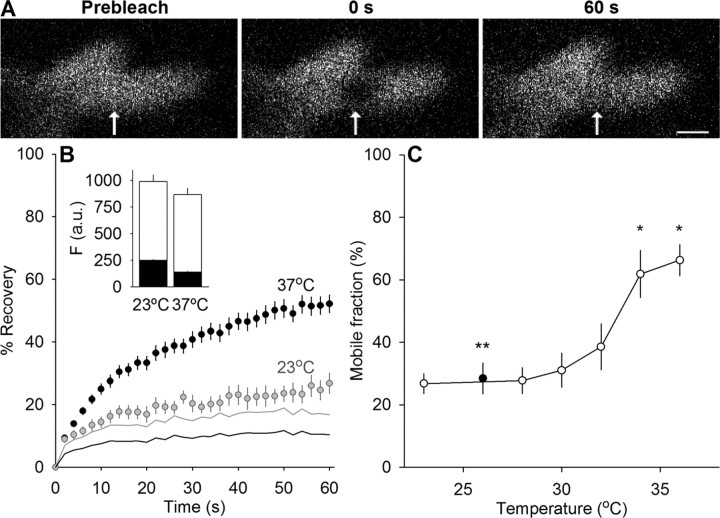
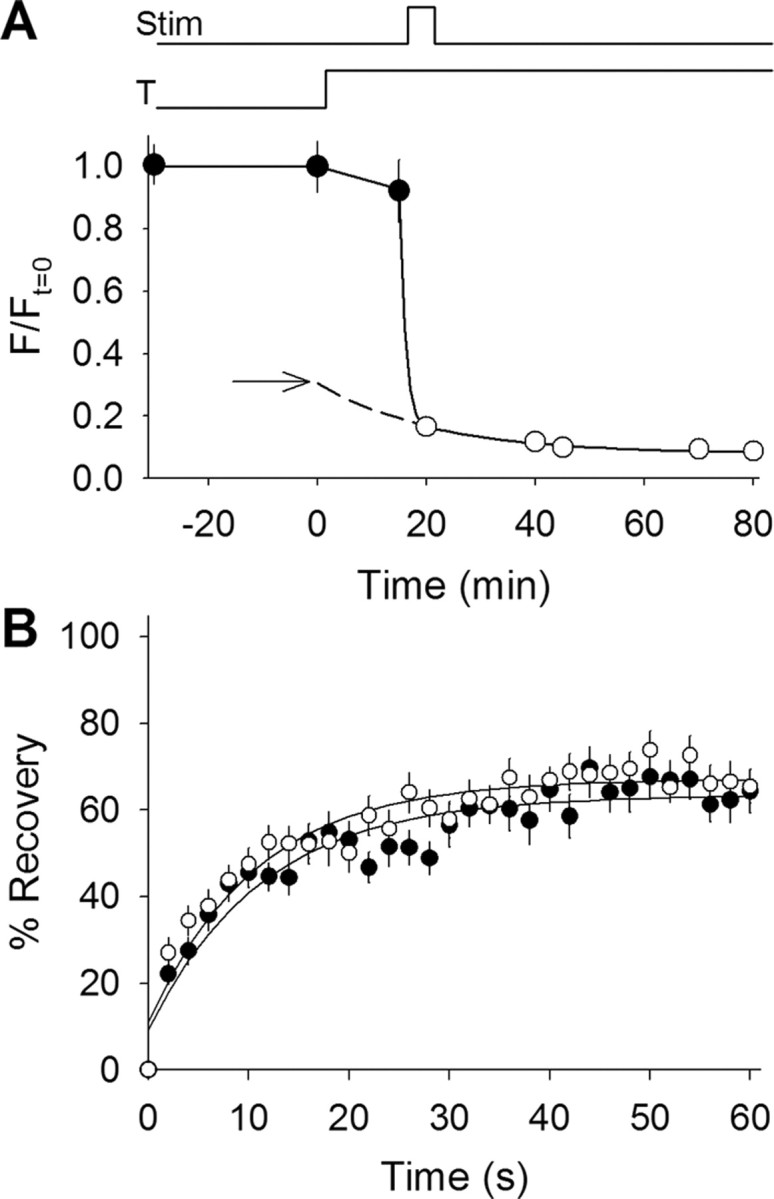
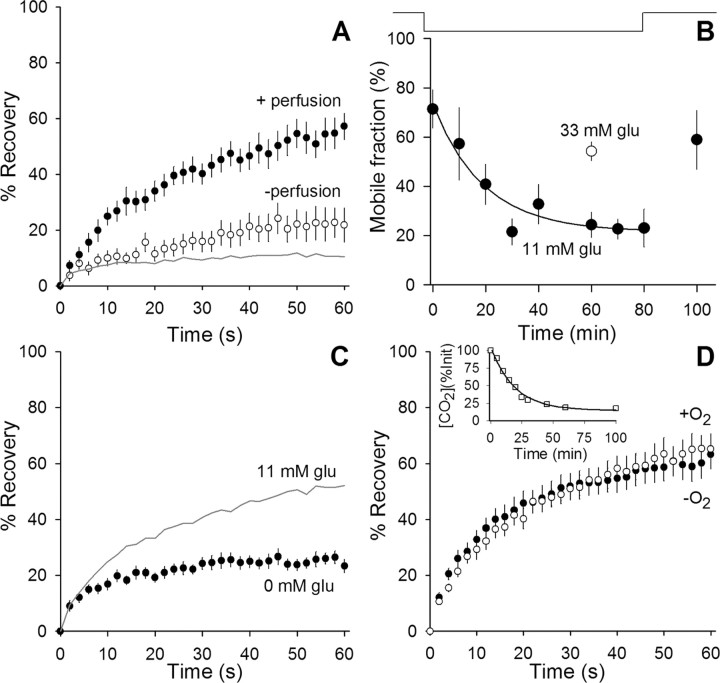
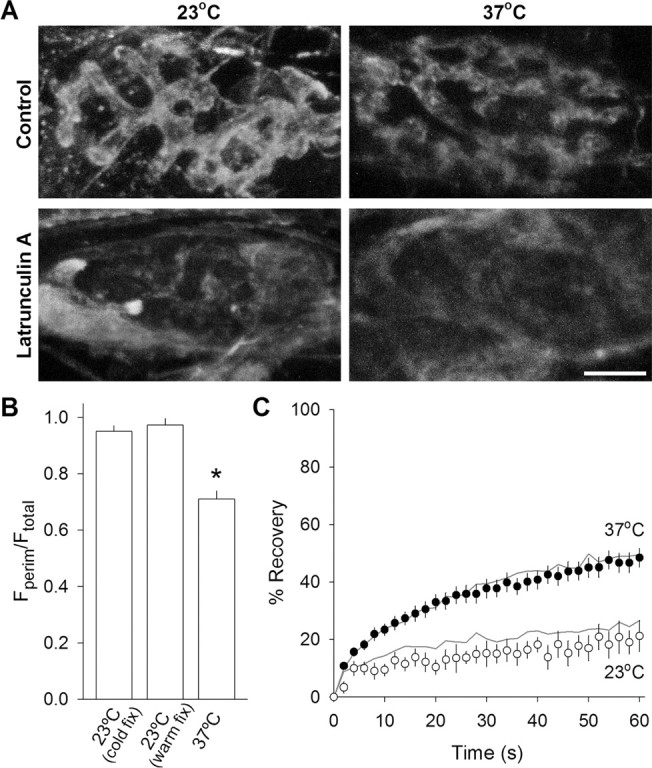
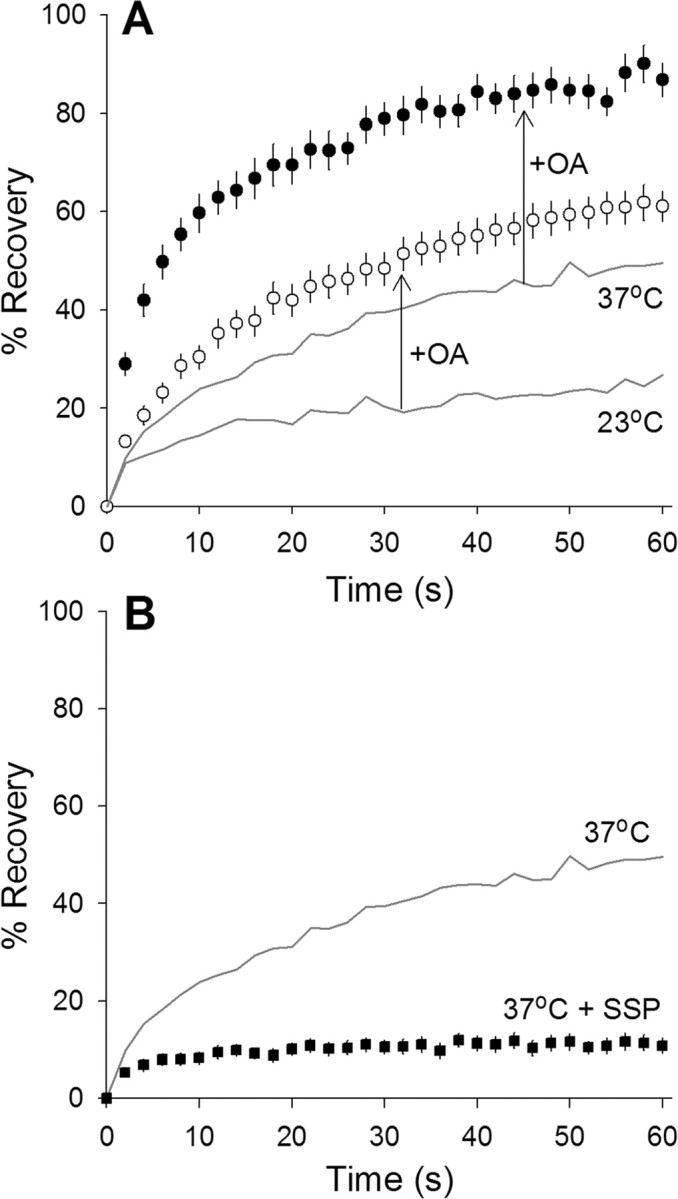
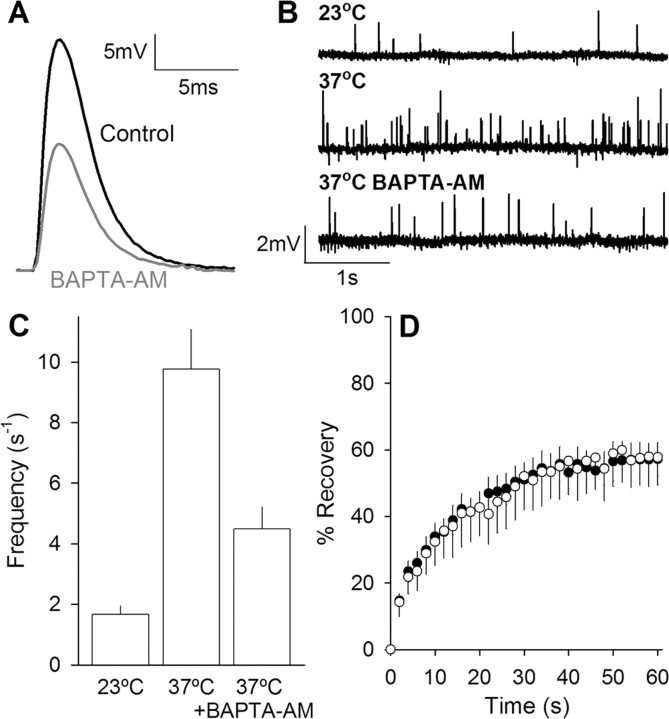
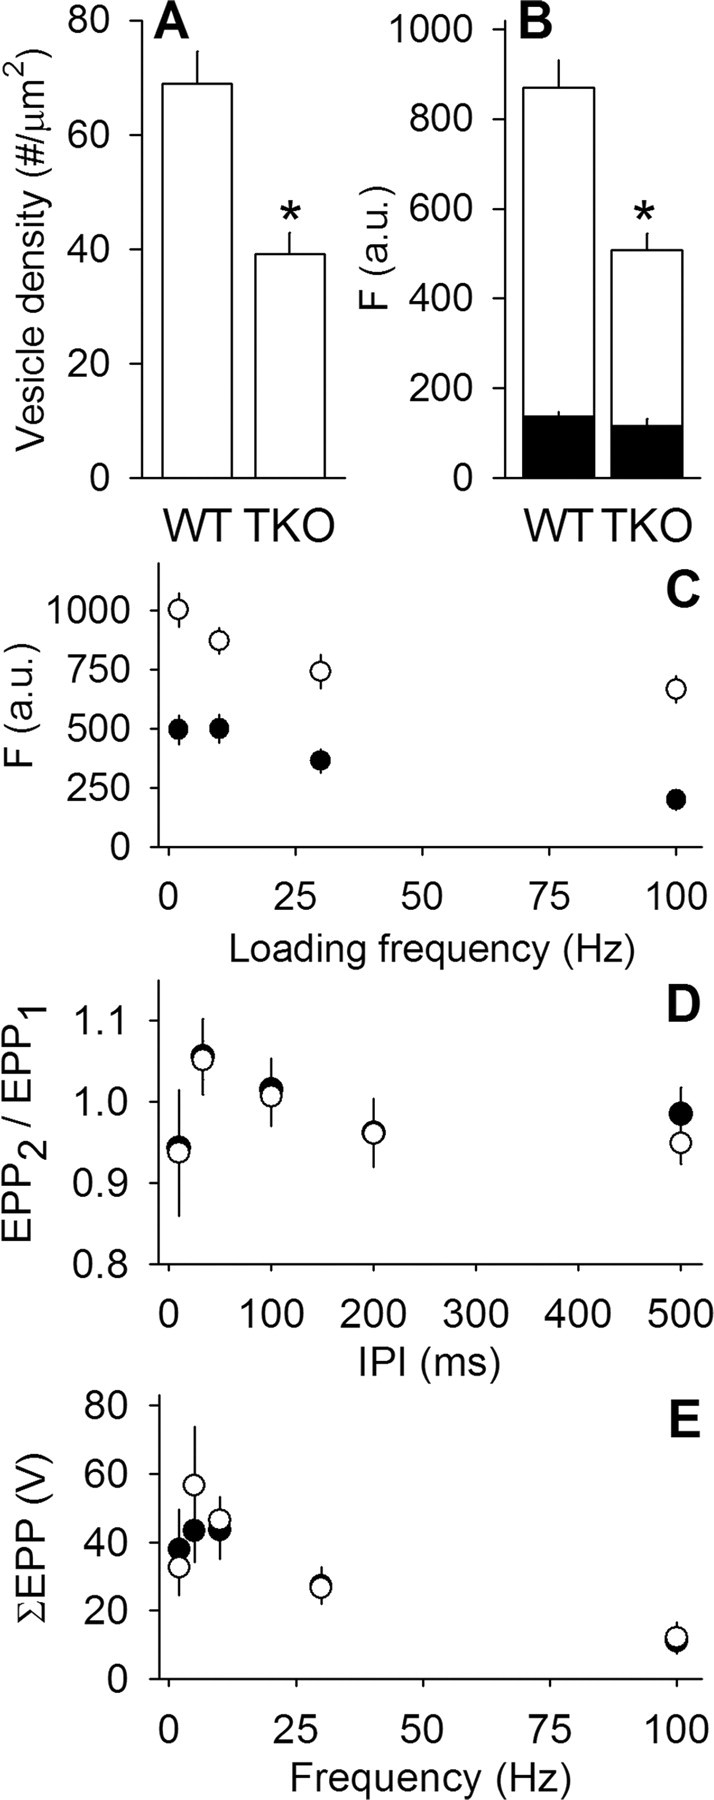
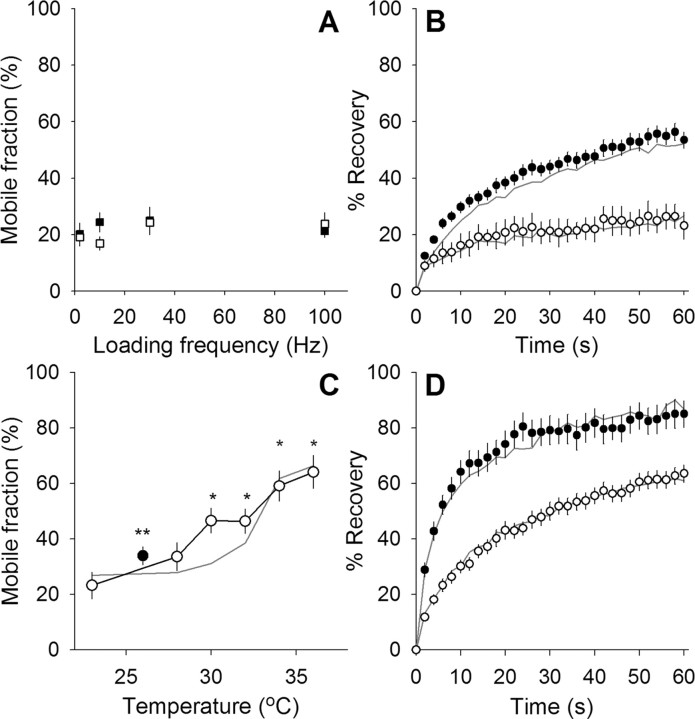
We measured synaptic vesicle mobility using fluorescence recovery after photobleaching of FM 1-43 [N-(3-triethylammoniumpropyl)-4-(4-(dibutylamino)styryl) pyridinium dibromide] stained mouse motor nerve terminals obtained from wild-type (WT) and synapsin triple knock-out (TKO) mice at room temperature and physiological temperature. Vesicles were mobile in resting terminals at physiological temperature but virtually immobile at room temperature. Mobility was increased at both temperatures by blocking phosphatases with okadaic acid, decreased at physiological temperature by blocking kinases with staurosporine, and unaffected by disrupting actin filaments with latrunculin A or reducing intracellular calcium concentration with BAPTA-AM. Synapsin TKO mice showed reduced numbers of synaptic vesicles and reduced FM 1-43 staining intensity. Synaptic transmission, however, was indistinguishable from WT, as was synaptic vesicle mobility under all conditions tested. Thus, in TKO mice, and perhaps WT mice, a phospho-protein different from synapsin but otherwise of unknown identity is the primary regulator of synaptic vesicle mobility.


Figures

Figure 1.
Figure 1.
Synaptic vesicle fusion rate is higher at 37°C than at 23°C. A, Typical images of FM 1-43-labeled terminals before (top) and after (bottom) 30 Hz nerve stimulation for 300 s at 37°C. Scale bar, 2 μm. B, FM 1-43 destaining rates. FM 1-43 fluorescence intensity normalized to initial value. Nerve stimulation at 30 Hz during time marked by solid bar. Destaining was slow at 23°C (open circles; n = 4), and was much faster and more complete at 37°C (filled circles; n = 5). Destaining at 23°C could be accelerated if muscles were transiently warmed to 37°C and then cooled again to 23°C before stimulation (open squares; n = 4), suggesting that recycling of labeled vesicles was greatly slowed at 23°C. C, Electrophysiological recordings during nerve activity. End plate potential amplitudes (in 1.1 μm curare) for 50 shocks delivered at 100 Hz. Initial and steady-state amplitudes are higher at 37°C (filled circles; n = 17) than at 23°C (open circles; n = 18).
Figure 2.
Figure 2.
Synaptic vesicle mobility is higher at 37°C than at 23°C. A, Images from a typical FRAP experiment. A portion of a terminal labeled with FM 1-43 and maintained at 37°C was imaged before the bleach (left), immediately after the bleach (middle), and 60 s later (right). The arrow indicates the bleached region. Scale bar, 1 μm. B, Quantification of FRAP experiments. Fluorescence recovery plotted versus time for terminals maintained at 23°C (gray circles; n = 12) or 37°C (black circles; n = 66). The gray line and black line show average background contribution to fluorescence recovery for 23°C and 37°C, respectively. Inset, Contribution of synaptic vesicles (open bars) and background (filled bars) to total fluorescence at the two temperatures. For details, see Figure 3. a.u., Arbitrary units. C, Mobile fraction is plotted versus temperature. Open circles indicate mobility measurements taken as terminals were warmed from 23°C to 37°C (n ≥ 12 for each data point). The filled circle indicates mobility measurements taken after preparations reached full mobility at 37°C and then were cooled back to room temperature. *p < 0.01, significant compared with 23°C; **p < 0.01, significant compared with 37°C after cooling (Student's t test).
Figure 3.
Figure 3.
Background contributions to fluorescence recovery differ between 23°C and 37°C. A, Fluorescence measurements made before, during, and after a temperature increase from 23°C to 37°C and a destaining stimulus. Fluorescence remained constant at 23°C for 30 min (filled circles) and decreased slightly once the temperature was raised to 37°C (indicated by bottom line above plot; T). During stimulation (indicated by top line above plot; Stim) fluorescence fell to background levels. Background fluorescence (open circles) continued to decrease over time even after stimulation had ceased. The solid line through the open circles represents the best fit time constant (21 min) for background fluorescence loss. The dashed line extending from the best fit line indicates the time during which background fluorescence levels could not be measured. This includes the time required for stabilization of temperature and destaining of vesicular fluorescence. The dashed line was extended back to the zero time point (when heating began), thus providing an estimate of the initial background level at 23°C (arrow). Notice that most (if not all) of the fluorescence lost before stimulation was attributable to background and not synaptic vesicle fluorescence. Similar results were obtained for the synapsin TKO terminals used later (data not shown). B, Fluorescence recovery plotted versus time for the background fluorescence in WT (open circles; n = 18) and in the synapsin TKO terminals used later (filled circles; n = 25) measured at 37°C. The solid lines show single-exponential best fits with a time constant of ∼11 s for each trace. Little difference was observed between WT and synapsin TKO. The WT data were scaled to the background fluorescence fraction for plots shown in Figures 2B and 4A.
Figure 4.
Figure 4.
Glucose maintains high synaptic vesicle mobility at 37°C. A, Stopping perfusion greatly reduces vesicle mobility at 37°C. Fluorescence recovery is plotted versus time for terminals maintained at 37°C without any perfusion for >30 min (open circles; n = 9). Perfusion of the terminals with fresh, oxygenated saline solution containing 11 mm glucose (filled circles; n = 11) increased the mobility back to normal levels. The gray line indicates expected background contribution to recovery (as in Fig. 2B). B, Mobile fraction is plotted versus time. The line above the plot indicates when perfusion is on (up) or off (down). Data (filled circles; 10 min bins, n ≥ 3 for each data point) show a reduction in mobility with a time constant of ∼19 min after perfusion was stopped. Once perfusion began again, mobility recovered. The open circle (n = 12) shows mobile fraction when glucose was increased from normal (11 mm) to 33 mm. Mobility remained high in 33 mm glucose for at least 1 h after perfusion was stopped. C, Fluorescence recovery plotted versus time in terminals maintained at 37°C and perfused with oxygenated saline solution containing 0 mm glucose (filled circles; n = 14). For comparison, results collected from terminals perfused with solution containing 11 mm glucose are shown (gray line; data from Fig. 2B). D, Bubbling oxygen into the perfusing solution is not required to maintain synaptic vesicle mobility. Fluorescence recovery is plotted versus time comparing measurements taken from terminals maintained at 37°C with 11 mm glucose and bubbling oxygen (open circles) and 30 min after bubbling oxygen into the perfusing solution was stopped (filled circles; n = 21). Inset, Time course of gases leaving solution. Open squares show dissolved [CO2] (calculated by measuring pH) once perfusion stopped at time 0. The solid line shows exponential best fit with a time constant of ∼19 min. O2 is expected to leave at a slightly faster rate with an ∼16 min time constant attributable to faster diffusion rates (and similar effusion rates).
Figure 5.
Figure 5.
Latrunculin A disrupts actin but not synaptic vesicle mobility. A, Actin immunostaining. Typical images of β-actin staining pattern under four conditions: control (top row) and after latrunculin A treatment (15 μm for at least 45 min; bottom row) fixed after maintaining the terminals at either 23°C (left column) or 37°C (right column). The blurred staining seen in latrunculin A-treated terminals was outside of the terminal and was typical of all terminals surveyed. Scale bar, 5 μm. B, Quantification of fluorescence distribution of β-actin staining pattern. The ratio of the average perimeter fluorescence to average total fluorescence for each terminal is plotted for 23°C with cold fixative (left bar; n = 20), 23°C with a warm fixative (middle bar; n = 7), and 37°C (n = 16). A larger value indicates that fluorescence is distributed more peripherally. *p < 0.01, significantly different from other two conditions (Student's t test). C, Fluorescence recovery over time for latrunculin A-treated terminals (symbols) compared with controls (gray lines). Latrunculin A incubation had no significant effect at either 23°C (open circles; n = 5) or at 37°C (filled circles; n = 37).
Figure 6.
Figure 6.
Phosphorylation regulates synaptic vesicle mobility. A, Okadaic acid (OA) mobilizes synaptic vesicles. Fluorescence recovery over time for terminals maintained at 23°C (open circles) or 37°C (filled circles) after application of okadaic acid (1 μm for at least 45 min). Okadaic acid increased mobility above controls at both 23°C (compare with bottom gray line) and 37°C (compare with top gray line). n ≥ 23 for each condition. B, Staurosporine (SSP) prevents synaptic vesicle mobilization. Fluorescence recovery over time for terminals maintained at 37°C (filled squares; n = 32) after application of staurosporine (1 μm for at least 45 min). Staurosporine blocks the expected temperature-dependent increase in synaptic vesicle mobility (gray line).
Figure 7.
Figure 7.
Chelation of intracellular calcium with BAPTA-AM does not affect synaptic vesicle mobility at 37°C. A, BAPTA-AM reduces end plate potential amplitude. Typical end plate potential recordings taken from control (in 1.5 μm μ-conotoxin; black line) or BAPTA-AM-treated terminals (gray line). B, BAPTA-AM reduces temperature-dependent rise in miniature end plate potential frequency. Example recordings from miniature end plate potentials collected at 23°C, 37°C, or 37°C plus incubation with BAPTA-AM (100 μm for 1.5 h). C, Quantification of temperature-dependent rise in miniature end plate potential frequency and subsequent reduction in frequency after BAPTA-AM incubation. Each condition is significantly different from the other two (Student's t test; p < 0.01, n ≥ 9 for each condition). D, Fluorescence recovery plotted versus time for data collected before (open circles; n = 9; downward error bars) and after (filled circles; n = 22; upward error bars) BAPTA-AM (100 μm for 1.5 h) incubation. For clarity, error bars are shown in one direction only.
Figure 8.
Figure 8.
Motor nerve terminals lacking synapsin have fewer synaptic vesicles but normal electrophysiology. A, Quantification of synaptic vesicle numbers in synapsin TKO terminals. Synaptic vesicle density (plotted as number of vesicles per square micrometer of terminal area) is reduced by ∼50%. *p < 0.01, significant difference (Student's t test). n = 31 for WT and 36 for TKO. B, FM 1-43 fluorescence [arbitrary units (a.u.)] is reduced in synapsin TKO terminals. The standard loading protocol (30 Hz, 1 min nerve stimulation at 23°C) results in approximately half as much destainable fluorescence (open bars) in synapsin TKO compared with WT termi-nals. Background fluorescence is not significantly different (filled bars). *p < 0.01, significant difference in destainable fluorescence (Student's t test). n ≥ 15 terminals for each condition. C, FM 1-43 fluorescence (arbitrary units) after background subtraction for WT (open circles; n ≥ 12 for each data point) and synapsin TKO terminals (filled circles; n ≥ 15 for each data point) resulting from several different loading frequencies at 1800 shocks. D, Paired-pulse ratio, plotted as the ratio of the second end plate potential to the first end plate potential, is shown for several interpulse intervals (IPI) at 23°C. No significant difference between WT (open circles) and synapsin TKO terminals (filled circles) was found. n ≥ 5 for each data point. E, Summed end plate potential amplitudes are plotted for several different stimulus frequencies (each applied for 1800 shocks at 23°C). No significant difference between WT (open circles) and synapsin TKO terminals (filled circles) was found. n ≥ 5 for each data point.
Figure 9.
Figure 9.
Synapsin is not required for phosphorylation-dependent regulation of synaptic vesicle mobility. A, Mobile fraction is shown for terminals loaded with FM 1-43 at several frequencies (each applied for 1800 shocks at 23°C). None of the loading frequencies allowed access to a large mobile fraction in either WT (open squares; n ≥ 8 for each data point) or synapsin TKO terminals (filled squares; n ≥ 6 for each data point). B, Fluorescence recovery over time for terminals maintained at 23°C (open circles) and 37°C (filled circles). No major difference was observed between WT (gray lines; data from Fig. 2B) and synapsin TKO terminals (n = 10 for 23°C and 57 for 37°C). Background contribution to recovery (data not shown) was not significantly different between WT and synapsin TKO (see Figs. 3B, 8B). C, Mobile fraction is plotted versus bath temperature for synapsin TKO terminals (symbols; n ≥ 9 for each data point). Open circles indicate mobility measurements taken as nerve terminals were warmed. The filled circle shows data obtained after preparations reached full mobility at 37°C and then were cooled to room temperature. *p < 0.01, significant compared with 23°C; **p < 0.01, significant compared with 37°C (Student's t test). Gray line shows WT data from Figure 2C for comparison. D, Fluorescence recovery plotted versus time in okadaic-acid-treated terminals. Okadaic acid had nearly identical effects on both WT (gray lines; data from Fig. 6A) and synapsin TKO terminals at both 23°C (open circles; n = 23) and 37°C (filled circles; n = 23).

References

    1. Angaut-Petit D, Molgo J, Connold AL, Faille L. The levator auris longus muscle of the mouse: a convenient preparation for studies of short- and long-term presynaptic effects of drugs or toxins. Neurosci Lett. 1987;82:83–88. - PubMed
    1. Bauerfeind R, Takei K, De Camilli P. Amphiphysin I is associated with coated endocytic intermediates and undergoes stimulation-dependent dephosphorylation in nerve terminals. J Biol Chem. 1997;272:30984–30992. - PubMed
    1. Benfenati F, Bahler M, Jahn R, Greengard P. Interactions of synapsin I with small synaptic vesicles: distinct sites in synapsin I bind to vesicle phospholipids and vesicle proteins. J Cell Biol. 1989;108:1863–1872. - PMC - PubMed
    1. Betz WJ, Henkel AW. Okadaic acid disrupts clusters of synaptic vesicles in frog motor nerve terminals. J Cell Biol. 1994;124:843–854. - PMC - PubMed
    1. Burns ME, Sasaki T, Takai Y, Augustine GJ. Rabphilin-3A: a multifunctional regulator of synaptic vesicle traffic. J Gen Physiol. 1998;111:243–255. - PMC - PubMed

Publication types

MeSH terms

LinkOut - more resources