

Multiple displacement amplification enables large-scale clonal analysis following retroviral gene therapy
- PMID: 18077708
- PMCID: PMC2258920
- DOI: 10.1128/JVI.00584-07
Multiple displacement amplification enables large-scale clonal analysis following retroviral gene therapy
Abstract
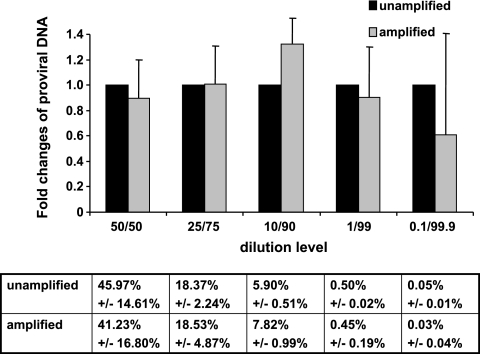
Analysis of the fate of retrovirally transduced cells after transplantation is often hampered by the scarcity of available DNA. We evaluated a promising method for whole-genome amplification, called multiple displacement amplification (MDA), with respect to even and accurate representation of retrovirally transduced genomic DNA. We proved that MDA is a suitable method to subsequently quantify engraftment efficiencies by quantitative real-time PCR by analyzing retrovirally transduced DNA in a background of untransduced DNA and retroviral integrations found in primary material from a retroviral transplantation model. The portion of these retroviral integrations in the amplified samples was 1.02-fold (range 0.2, to 2.1-fold) the portion determined in the original genomic DNA. Integration site analysis by ligation-mediated PCR (LM-PCR) is essential for the detection of retroviral integrations. The combination of MDA and LM-PCR showed an increase in the sensitivity of integration site analysis, as a specific integration site could be detected in a background of untransduced DNA, while the transduced DNA made up only 0.001%. These results show for the first time that MDA enables large-scale sensitive detection and reliable quantification of retrovirally transduced human genomic DNA and therefore facilitates follow-up analysis in gene therapy studies even from the smallest amounts of starting material.
Figures


Similar articles
-
Evaluating a ligation-mediated PCR and pyrosequencing method for the detection of clonal contribution in polyclonal retrovirally transduced samples.Hum Gene Ther Methods. 2013 Apr;24(2):68-79. doi: 10.1089/hgtb.2012.175. Epub 2013 Mar 14. Hum Gene Ther Methods. 2013. PMID: 23384086 Free PMC article.
-
Transplantation of human hematopoietic progenitor cells transduced with a retroviral vector containing the human multidrug-resistance-1 gene for myeloprotective gene therapy.Transplant Proc. 2002 Sep;34(6):2325-9. doi: 10.1016/s0041-1345(02)03255-4. Transplant Proc. 2002. PMID: 12270418 No abstract available.
-
Blockerette-ligated capture T7-amplified RT-PCR, a new method for determining flanking sequences.Mol Ther. 2002 Jul;6(1):113-8. doi: 10.1006/mthe.2002.0637. Mol Ther. 2002. PMID: 12095311
-
Whole genome amplification with Phi29 DNA polymerase to enable genetic or genomic analysis of samples of low DNA yield.Methods Mol Biol. 2008;439:1-18. doi: 10.1007/978-1-59745-188-8_1. Methods Mol Biol. 2008. PMID: 18370092 Review.
-
Integration of retroviral vectors.Curr Opin Immunol. 2012 Oct;24(5):592-7. doi: 10.1016/j.coi.2012.08.006. Epub 2012 Sep 14. Curr Opin Immunol. 2012. PMID: 22981243 Review.
Cited by
-
Genome areas with high gene density and CpG island neighborhood strongly attract porcine endogenous retrovirus for integration and favor the formation of hot spots.J Virol. 2009 Feb;83(4):1920-9. doi: 10.1128/JVI.00856-08. Epub 2008 Nov 26. J Virol. 2009. PMID: 19036816 Free PMC article.
-
Prospects of Microfluidic Technology in Nucleic Acid Detection Approaches.Biosensors (Basel). 2023 May 27;13(6):584. doi: 10.3390/bios13060584. Biosensors (Basel). 2023. PMID: 37366949 Free PMC article. Review.
-
High efficiency restriction enzyme-free linear amplification-mediated polymerase chain reaction approach for tracking lentiviral integration sites does not abrogate retrieval bias.Hum Gene Ther. 2013 Jan;24(1):38-47. doi: 10.1089/hum.2012.082. Epub 2012 Oct 26. Hum Gene Ther. 2013. PMID: 22992116 Free PMC article.
-
Isothermal Amplification of Nucleic Acids Coupled with Nanotechnology and Microfluidic Platforms for Detecting Antimicrobial Drug Resistance and Beyond.Adv Pharm Bull. 2022 Jan;12(1):58-76. doi: 10.34172/apb.2022.004. Epub 2021 Jan 30. Adv Pharm Bull. 2022. PMID: 35517891 Free PMC article. Review.
-
Multiple Displacement Amplification as a Solution for Low Copy Number Plasmid Sequencing.Front Microbiol. 2021 Feb 11;12:617487. doi: 10.3389/fmicb.2021.617487. eCollection 2021. Front Microbiol. 2021. PMID: 33643244 Free PMC article.
References
-
- Baum, C., O. Kustikova, U. Modlich, Z. Li, and B. Fehse. 2006. Mutagenesis and oncogenesis by chromosomal insertion of gene transfer vectors. Hum. Gene Ther. 17253-263. - PubMed
-
- Dean, F. B., S. Hosono, L. Fang, X. Wu, A. F. Faruqi, P. Bray-Ward, Z. Sun, Q. Zong, Y. Du, J. Du, M. Driscoll, W. Song, S. F. Kingsmore, M. Egholm, and R. S. Lasken. 2002. Comprehensive human genome amplification using multiple displacement amplification. Proc. Natl. Acad. Sci. USA 995261-5266. - PMC - PubMed
-
- Hacein-Bey-Abina, S., C. Von Kalle, M. Schmidt, M. P. McCormack, N. Wulffraat, P. Leboulch, A. Lim, C. S. Osborne, R. Pawliuk, E. Morillon, R. Sorensen, A. Forster, P. Fraser, J. I. Cohen, G. de Saint Basile, I. Alexander, U. Wintergerst, T. Frebourg, A. Aurias, D. Stoppa-Lyonnet, S. Romana, I. Radford-Weiss, F. Gross, F. Valensi, E. Delabesse, E. Macintyre, F. Sigaux, J. Soulier, L. E. Leiva, M. Wissler, C. Prinz, T. H. Rabbitts, F. Le Deist, A. Fischer, and M. Cavazzana-Calvo. 2003. LMO2-associated clonal T cell proliferation in two patients after gene therapy for SCID-X1. Science 302415-419. - PubMed
Publication types
MeSH terms
Substances
LinkOut - more resources
Full Text Sources
Medical
