. 2008 Feb;82(4):1870-83.
doi: 10.1128/JVI.02228-07. Epub 2007 Dec 12.

Chronic CD4+ T-cell activation and depletion in human immunodeficiency virus type 1 infection: type I interferon-mediated disruption of T-cell dynamics

Affiliations

Chronic CD4+ T-cell activation and depletion in human immunodeficiency virus type 1 infection: type I interferon-mediated disruption of T-cell dynamics

Ahmad R Sedaghat et al. J Virol. 2008 Feb.

Abstract

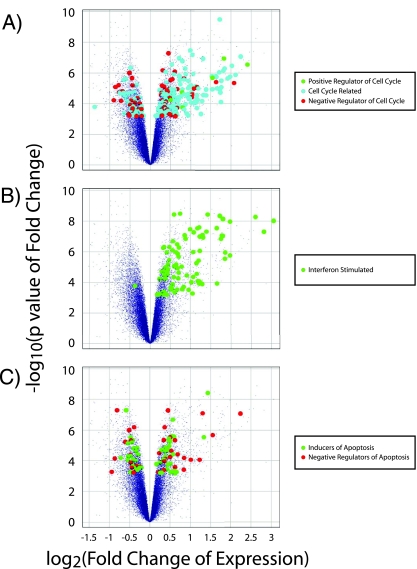
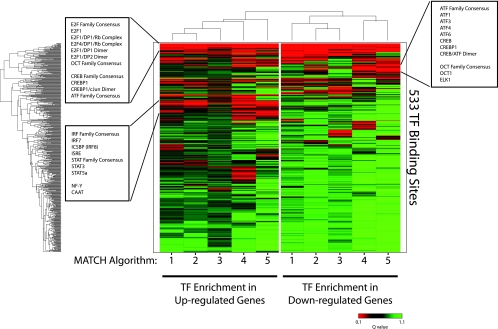
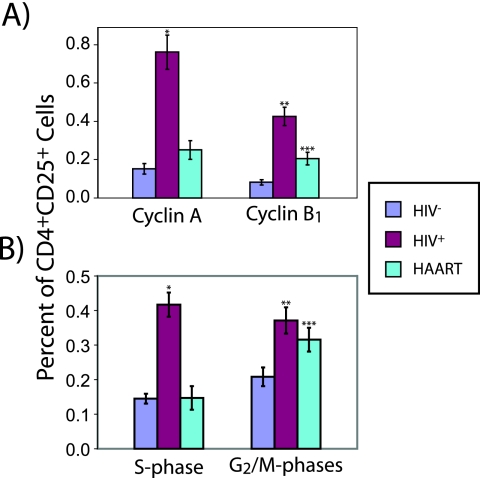
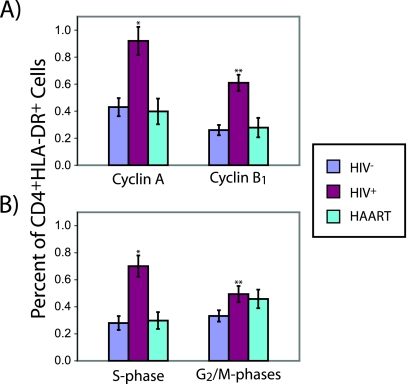
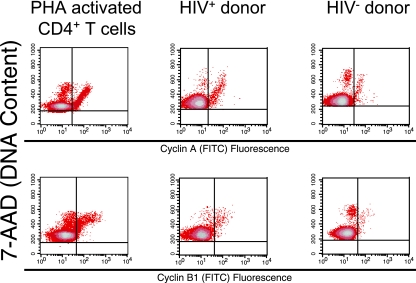
The mechanism of CD4(+) T-cell depletion during chronic human immunodeficiency virus type 1 (HIV-1) infection remains unknown. Many studies suggest a significant role for chronic CD4(+) T-cell activation. We assumed that the pathogenic process of excessive CD4(+) T-cell activation would be reflected in the transcriptional profiles of activated CD4(+) T cells. Here we demonstrate that the transcriptional programs of in vivo-activated CD4(+) T cells from untreated HIV-positive (HIV(+)) individuals are clearly different from those of activated CD4(+) T cells from HIV-negative (HIV(-)) individuals. We observed a dramatic up-regulation of cell cycle-associated and interferon-stimulated transcripts in activated CD4(+) T cells of untreated HIV(+) individuals. Furthermore, we find an enrichment of proliferative and type I interferon-responsive transcription factor binding sites in the promoters of genes that are differentially expressed in activated CD4(+) T cells of untreated HIV(+) individuals compared to those of HIV(-) individuals. We confirm these findings by examination of in vivo-activated CD4(+) T cells. Taken together, these results suggest that activated CD4(+) T cells from untreated HIV(+) individuals are in a hyperproliferative state that is modulated by type I interferons. From these results, we propose a new model for CD4(+) T-cell depletion during chronic HIV-1 infection.


Figures

FIG. 1.
FIG. 1.
Differential expression of transcripts in CD4+ CD25+ T cells from untreated HIV+ individuals compared to expression in those from HIV individuals. (A) Heat map of 3,743 differentially expressed transcripts in CD4+ CD25+ T cells from untreated HIV+ individuals compared to those in cells from HIV individuals. Rows and columns are arranged by hierarchical clustering. Coloring was based on the log2 change over the row mean (mean expression across all samples). (B) The breakdown of the magnitudes of change for significantly up- and down-regulated transcripts in CD4+ CD25+ T cells from untreated HIV+ individuals compared to those in cells from HIV individuals.
FIG. 2.
FIG. 2.
Differential expression profile of transcripts categorized as cell cycle associated, interferon stimulated, or regulators of apoptosis. Volcano plots of microarray results (small purple dots) with identification of differentially expressed positive regulators of the cell cycle (green circles), cell cycle-associated transcripts (blue circles), or negative regulators of the cell cycle (red circles) (A); interferon-stimulated genes (B), or inducers of apoptosis (green circles) or negative regulators of apoptosis (red circles) (C). The vertical axis represents significance [−log10(P value)], and the horizontal axis represents the change in gene expression for HIV+ individuals compared to that for HIV individuals [−log2(fold change)].
FIG. 3.
FIG. 3.
Enrichment of TF binding sites in the promoters of differentially expressed genes. Hierarchical clustering and heat map of Q values calculated for the enrichment of TF binding sites in the promoters of differentially expressed genes in CD4+ CD25+ T cells from untreated HIV+ individuals compared to those from HIV individuals. The color represents the degree of significance for the Q value (green = low significance; red = high significance). Each row represents a specific TF binding site specified by a high-quality position weight matrix in TRANSFAC, while each column reflects a different algorithm (user-defined cutoff) for significance in identifying a TF binding site in MATCH: 1, minimize the sum of both error rates; 2, mat. sim. = 0.90; core sim. = 0.90; 3, mat. sim. = 0.80; core sim. = 0.85; 4, minimize false positives; 5, mat. sim. = 0.95; core sim. = 0.95.
FIG. 4.
FIG. 4.
Cell cycle parameters of in vivo-activated T cells (CD4+ CD25+). Percentage of in vivo-activated T cells (CD4+ CD25+) from HIV (n = 11) or untreated HIV+ individuals (n = 15) or from HIV+ individuals on HAART (n = 7) expressing either cyclin A or B1 (P value for comparison to HIV samples: *, <2 × 10⁻⁵; **, <5 × 10⁻⁶; ***, <0.01) (A) or in either the S or G2/M phase of the cell cycle (P value for comparison to HIV samples: *, <5 × 10⁻⁷; **, <0.002; ***, <0.03) (B). Error bars represent one standard error.
FIG. 5.
FIG. 5.
Cell cycle parameters of in vivo-activated T cells (CD4+ HLA-DR+). Percentage of in vivo CD4+ HLA-DR+ T cells from HIV (n = 9) or untreated HIV+ individuals (n = 14) or from HIV+ individuals on HAART (n = 6) expressing either cyclin A or B1 (P value for comparison to HIV samples: *, <9 × 10⁻⁴; **, <9 × 10⁻⁵ (A) or in either the S or G2/M phase of the cell cycle (P value for comparison to HIV samples: *, <2 × 10⁻⁴; **, <0.04) (B). Error bars represent one standard error.
FIG. 6.
FIG. 6.
Cell cycle phase expression of cyclins A and B1 in CD4+ T cells. Cell cycle phase expression of cyclin A and cyclin B1 in PHA-activated CD4+ T cells and CD4+ CD25+ T cells from HIV or untreated HIV+ individuals.
FIG. 7.
FIG. 7.
A model of CD4+ T-cell dynamics. A model of CD4+ T-cell dynamics in a healthy individual (A) or in an untreated HIV+ individual (B), where HIV-1 antigens enhance the rate of activation of naive and memory cells while type I interferons skew the activated T-cell differentiation toward short-lived effector cells instead of long-lived memory cells.

References

    1. Aho, T. L., R. J. Lund, E. K. Ylikoski, S. Matikainen, R. Lahesmaa, and P. J. Koskinen. 2005. Expression of human pim family genes is selectively up-regulated by cytokines promoting T helper type 1, but not T helper type 2, cell differentiation. Immunology 11682-88. - PMC - PubMed
    1. Anderson, R. W., M. S. Ascher, and H. W. Sheppard. 1998. Direct HIV cytopathicity cannot account for CD4 decline in AIDS in the presence of homeostasis: a worst-case dynamic analysis. J. Acquir. Immune Defic. Syndr. Hum. Retrovirol. 17245-252. - PubMed
    1. Appay, V., J. R. Almeida, D. Sauce, B. Autran, and L. Papagno. 2007. Accelerated immune senescence and HIV-1 infection. Exp. Gerontol. 42432-437. - PubMed
    1. Ashburner, M., C. A. Ball, J. A. Blake, D. Botstein, H. Butler, J. M. Cherry, A. P. Davis, K. Dolinski, S. S. Dwight, J. T. Eppig, M. A. Harris, D. P. Hill, L. Issel-Tarver, A. Kasarskis, S. Lewis, J. C. Matese, J. E. Richardson, M. Ringwald, G. M. Rubin, G. Sherlock, et al. 2000. Gene ontology: tool for the unification of biology. Nat. Genet. 2525-29. - PMC - PubMed
    1. Audige, A., M. Urosevic, E. Schlaepfer, R. Walker, D. Powell, S. Hallenberger, H. Joller, H. U. Simon, R. Dummer, and R. F. Speck. 2006. Anti-HIV state but not apoptosis depends on IFN signature in CD4+ T cells. J. Immunol. 1776227-6237. - PubMed

Publication types

Substances