. 2007 Nov-Dec;128(11-12):706-16.
doi: 10.1016/j.mad.2007.10.013. Epub 2007 Nov 4.

Reduced mitochondrial SOD displays mortality characteristics reminiscent of natural aging

Affiliations

Reduced mitochondrial SOD displays mortality characteristics reminiscent of natural aging

Anirban Paul et al. Mech Ageing Dev. 2007 Nov-Dec.

Abstract

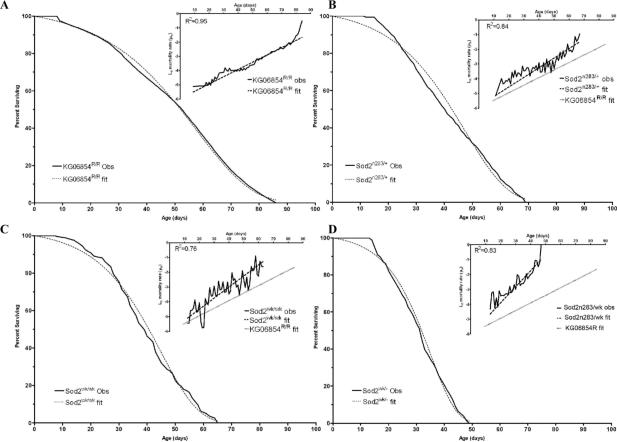
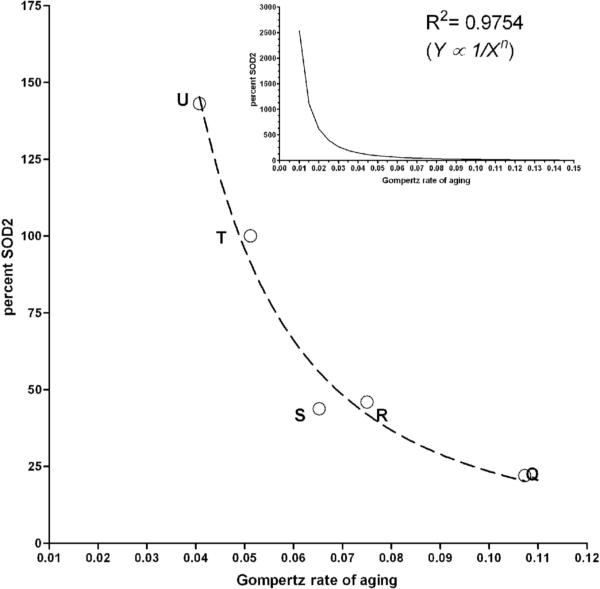
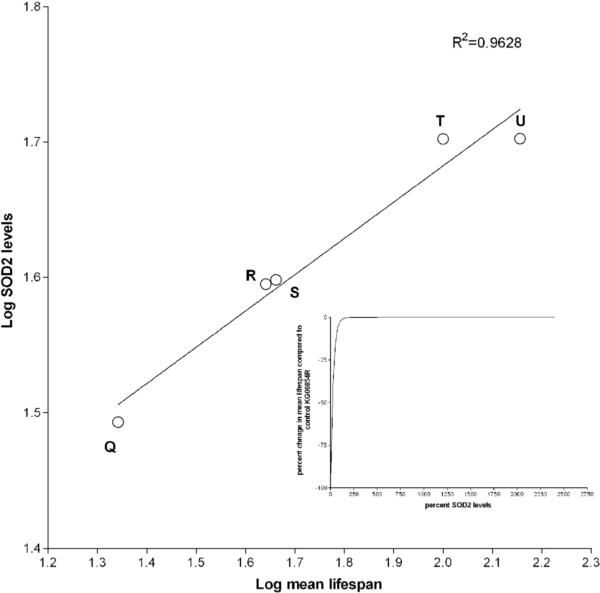
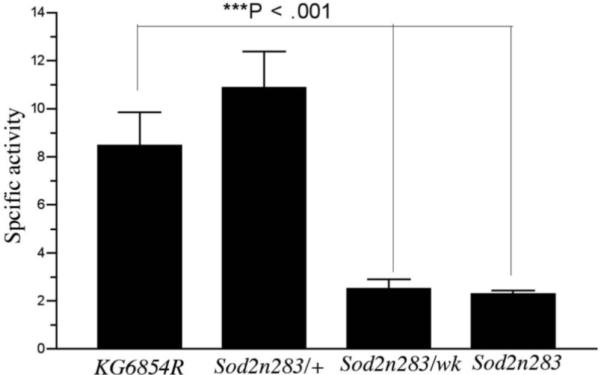
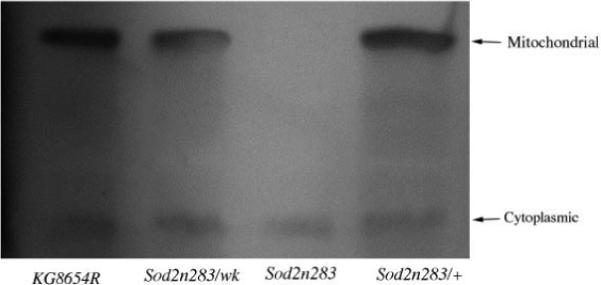
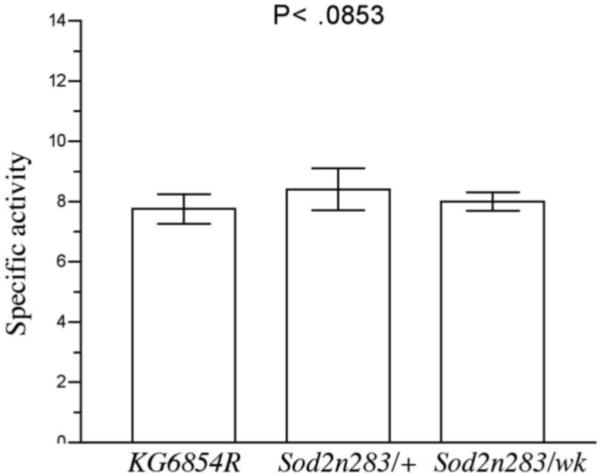
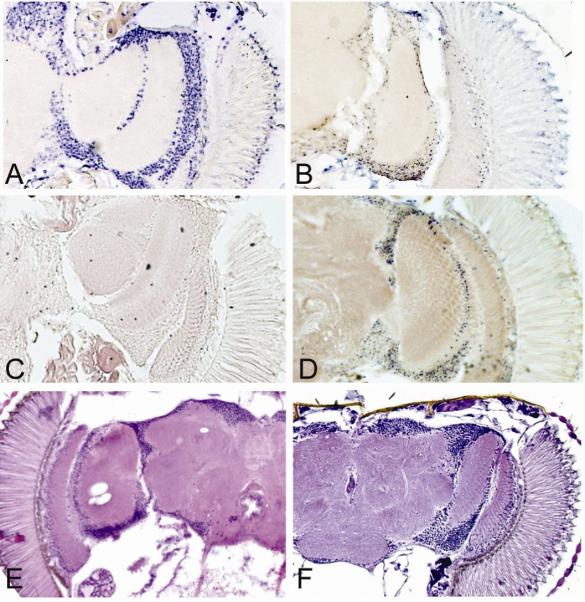
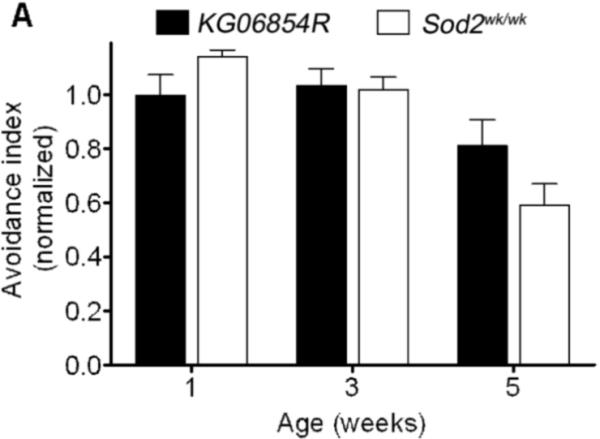
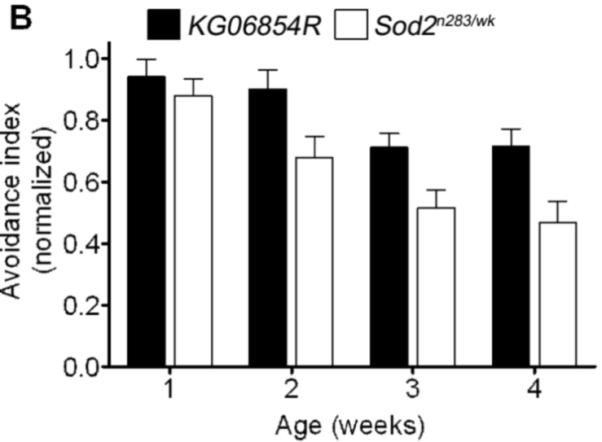
Manganese superoxide dismutase (MnSOD or SOD2) is a key mitochondrial enzymatic antioxidant. Arguably the most striking phenotype associated with complete loss of SOD2 in flies and mice is shortened life span. To further explore the role of SOD2 in protecting animals from aging and age-associated pathology, we generated a unique collection of Drosophila mutants that progressively reduce SOD2 expression and function. Mitochondrial aconitase activity was substantially reduced in the Sod2 mutants, suggesting that SOD2 normally ensures the functional capacity of mitochondria. Flies with severe reductions in SOD2 expression exhibited accelerated senescence of olfactory behavior as well as precocious neurodegeneration and DNA strand breakage in neurons. Furthermore, life span was progressively shortened and age-dependent mortality was increased in conjunction with reduced SOD2 expression, while initial mortality and developmental viability were unaffected. Interestingly, life span and age-dependent mortality varied exponentially with SOD2 activity, indicating that there might normally be a surplus of this enzyme for protecting animals from premature death. Our data support a model in which disruption of the protective effects of SOD2 on mitochondria manifests as profound changes in behavioral and demographic aging as well as exacerbated age-related pathology in the nervous system.


Figures

Figure 1
Figure 1
Molecular analysis of Sod2 alleles. Sod2n283 has a 167 bp deletion within exon 1 and part of intron 1. The span of the deletion was confirmed by sequencing a unique PCR band that arose in Sod2n283 when primer combination 1 and 5 were used. Sequence data revealed that 18 nt of P-element sequence (lower case letters) were left in Sod2n283. Sod2wk is the original P-insertion located in the 5’ untranslated region of Sod2. KG06854R is a precise excision derivative of KG06854 as revealed by DNA sequencing (not shown). Molecular coordinates are according to FlyBase release 3.0.
Figure 2
Figure 2
Levels of SOD2 protein, mRNA, and activities in various Sod2 alleles. (A) Histogram showing the expression of SOD2 protein in different alleles relative to the control KG06854R. Densitometric analysis revealed that Sod2wk/wk and Sod2n283/+ flies, respectively, encode about 46% and 44% of SOD2 protein relative to KG06854R. Sod2n283/wk double mutant expresses only 22% of SOD2 with respect to KG06854R. A transgenic line carrying four copies of Sod2 (obtained from Bill Orr, Southern Methodist University) encodes about 43% more SOD2 than KG06854R. Average of percent relative intensity values obtained from densitometric scans of three separate blots are shown in the table. Coomassie blue staining of the same blot established equal protein loading in each lane. Error bars indicate SD (n=3). (B) Sod2 mRNA expression. Real-time PCR was used to measure mRNA expression of Sod2 relative to RP49 control. Compared to KG06854R flies Sod2wk/wk, Sod2n283/+ and Sod2n283/wk express 59%, 62% and 33% mRNA for Sod2, respectively. (C) SOD2 activity. Sod2n283/+ heterozygotes have 50% of the SOD2 activity found in KG06854R controls whereas SOD2 activity is essentially undetectable in Sod2n283 homozygotes. The activity of SOD1 was unchanged in all three genotypes.
Figure 2
Figure 2
Levels of SOD2 protein, mRNA, and activities in various Sod2 alleles. (A) Histogram showing the expression of SOD2 protein in different alleles relative to the control KG06854R. Densitometric analysis revealed that Sod2wk/wk and Sod2n283/+ flies, respectively, encode about 46% and 44% of SOD2 protein relative to KG06854R. Sod2n283/wk double mutant expresses only 22% of SOD2 with respect to KG06854R. A transgenic line carrying four copies of Sod2 (obtained from Bill Orr, Southern Methodist University) encodes about 43% more SOD2 than KG06854R. Average of percent relative intensity values obtained from densitometric scans of three separate blots are shown in the table. Coomassie blue staining of the same blot established equal protein loading in each lane. Error bars indicate SD (n=3). (B) Sod2 mRNA expression. Real-time PCR was used to measure mRNA expression of Sod2 relative to RP49 control. Compared to KG06854R flies Sod2wk/wk, Sod2n283/+ and Sod2n283/wk express 59%, 62% and 33% mRNA for Sod2, respectively. (C) SOD2 activity. Sod2n283/+ heterozygotes have 50% of the SOD2 activity found in KG06854R controls whereas SOD2 activity is essentially undetectable in Sod2n283 homozygotes. The activity of SOD1 was unchanged in all three genotypes.
Figure 3
Figure 3
Life span and mortality in Sod2 mutants. Main plots are life span data. Insets are mortality data. In all graphs, solid lines are observed data and dotted lines are derived from the Gompertz's MLE parameters ‘a’ and ‘b’ using WinModest. In each genotype the predicted curve (dotted line) fits closely to the observed values (continuous line). (A) KG06854R controls. In B, C & D the grey continuous line in the mortality plots (insets) corresponds to the mortality trend of KG06854R and has been included for comparison of the difference in slope (initial mortality rate).
Figure 4
Figure 4
Relationship between SOD2 expression and demographic parameters. Q= Sod2n283/wk, R= Sod2n283/+, S= Sod2wk/wk, T= KG06854R and U= Sod2+/+; P{Sod2+/+}. (A) A power law relationship was observed when the demographic rate of aging (parameter b from WinModest) was plotted versus percent SOD2 expressed. R2 = 0.9636. Inset shows projected rate of demographic aging as a function of percent SOD2 expression, indicating that a marginal decrease in the rate of demographic aging will occur with progressively increased levels of SOD2 expression. (B) Log mean lifespan versus Log SOD2 expression describes a straight line, indicating that the percent change in mean lifespan will eventually plateau after a certain level of SOD2 expression is achieved (inset).
Figure 4
Figure 4
Relationship between SOD2 expression and demographic parameters. Q= Sod2n283/wk, R= Sod2n283/+, S= Sod2wk/wk, T= KG06854R and U= Sod2+/+; P{Sod2+/+}. (A) A power law relationship was observed when the demographic rate of aging (parameter b from WinModest) was plotted versus percent SOD2 expressed. R2 = 0.9636. Inset shows projected rate of demographic aging as a function of percent SOD2 expression, indicating that a marginal decrease in the rate of demographic aging will occur with progressively increased levels of SOD2 expression. (B) Log mean lifespan versus Log SOD2 expression describes a straight line, indicating that the percent change in mean lifespan will eventually plateau after a certain level of SOD2 expression is achieved (inset).
Figure 5
Figure 5
Aconitase and fumarase activity in Sod2 mutants. (A) Total aconitase activity was significantly less in Sod2n283 homozygotes and Sod2n283/wk transheterozygotes. Young Sod2n283/+ heterozygotes had normal aconitase activity. (B) Chromogenic detection of aconitase activity shows that mitochondrial aconitase consist of bulk of the celluar aconiatse. Complete absence of mitochondrial aconitase in Sod2n283 homozygotes suggests its breakdown by excessive ROS, (C) Fumarase activity remains unaltered in Sod2 mutants.
Figure 5
Figure 5
Aconitase and fumarase activity in Sod2 mutants. (A) Total aconitase activity was significantly less in Sod2n283 homozygotes and Sod2n283/wk transheterozygotes. Young Sod2n283/+ heterozygotes had normal aconitase activity. (B) Chromogenic detection of aconitase activity shows that mitochondrial aconitase consist of bulk of the celluar aconiatse. Complete absence of mitochondrial aconitase in Sod2n283 homozygotes suggests its breakdown by excessive ROS, (C) Fumarase activity remains unaltered in Sod2 mutants.
Figure 6
Figure 6
TUNEL staining and structural integrity of the brain in Sod2 mutants. (A-D) TUNEL staining. (A) TUNEL positive nuclei (in blue) in adult brain sections following the induction of DNA fragmentation with 2000U of DNase1. (B) Sod2n283 homozygote brains that are less than 20 hours old had many TUNEL positive nuclei due to either dying cells or DNA breaks induced by increased ROS production. (C) 0−5 day-old KG06854R brains had no TUNEL positive nuclei. (D) TUNEL positive nuclei appeared in Sod2n283/+ heterozygotes at ∼9 weeks of adulthood. (E-F) Hematoxylin-eosin stained sections of adult brains. (E) 29 day-old Sod2n283/wk transheterozygote with vigorous brain lesions. (F) 35 day-old KG06854R control with no detectable lesions.
Figure 7
Figure 7
Senescence of olfactory behavior in Sod2 mutants. (A) Two-way ANOVA indicated that avoidance of MCH in KG06854R (black bars) and Sod2wk/wk flies (open bars) declined with age (p<0.0001, n = 13−16) but was not affected by genotype. (B) Avoidance of MCH in both KG06854R and Sod2n283/wk flies declined with age (two-way ANOVA, effect of age, p<0.0001, n = 28−32). MCH avoidance in the two genotypes was significantly different (p<0.0001). Data in A and B are compiled from 2 and 4 independent experiments, respectively.
Figure 7
Figure 7
Senescence of olfactory behavior in Sod2 mutants. (A) Two-way ANOVA indicated that avoidance of MCH in KG06854R (black bars) and Sod2wk/wk flies (open bars) declined with age (p<0.0001, n = 13−16) but was not affected by genotype. (B) Avoidance of MCH in both KG06854R and Sod2n283/wk flies declined with age (two-way ANOVA, effect of age, p<0.0001, n = 28−32). MCH avoidance in the two genotypes was significantly different (p<0.0001). Data in A and B are compiled from 2 and 4 independent experiments, respectively.

References

    1. Bayne VA, Mockett RJ, Orr WC, Sohal RS. Enhanced catabolism of mitochondrial superoxide/hydrogen peroxide and aging in transgenic Drosophila. Biochem J. 2005;391:277–284. - PMC - PubMed
    1. Barja G. Rate of generation of oxidative stress-related damage and animal longevity. Free Radic Biol Med. 2002;33:1167–1172. - PubMed
    1. Bellen HJ, Levis RW, Liao G, He Y, Carlson JW, Tsang G, Evans-Holm M, Hiesinger PR, Schulze KL, Rubin GM, Hoskins RA, Spradling AC. The BDGP gene disruption project: single transposon insertions associated with 40% of Drosophila genes. Genetics. 2004;167:761–781. - PMC - PubMed
    1. Cook-Wiens E, Grotewiel MS. Dissociation between functional senescence and oxidative stress resistance in Drosophila. Exp Gerontol. 2002;37:1347–57. - PubMed
    1. Das N, Levine RL, Orr WC, Sohal RS. Selectivity of protein oxidative damage during aging in Drosophila melanogaster. Biochem J. 2001;360:209–16. - PMC - PubMed

Publication types

MeSH terms

LinkOut - more resources