. 2007 Dec 13;2(6):371-82.
doi: 10.1016/j.chom.2007.10.010.

Intestinal alkaline phosphatase detoxifies lipopolysaccharide and prevents inflammation in zebrafish in response to the gut microbiota

Affiliations

Intestinal alkaline phosphatase detoxifies lipopolysaccharide and prevents inflammation in zebrafish in response to the gut microbiota

Jennifer M Bates et al. Cell Host Microbe. .

Abstract

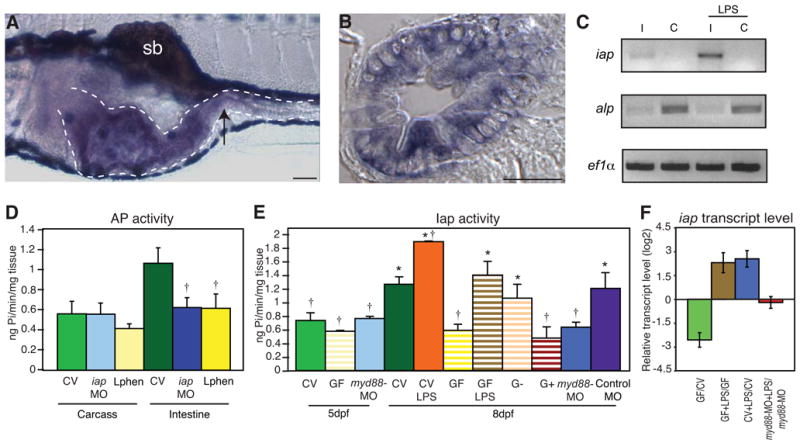
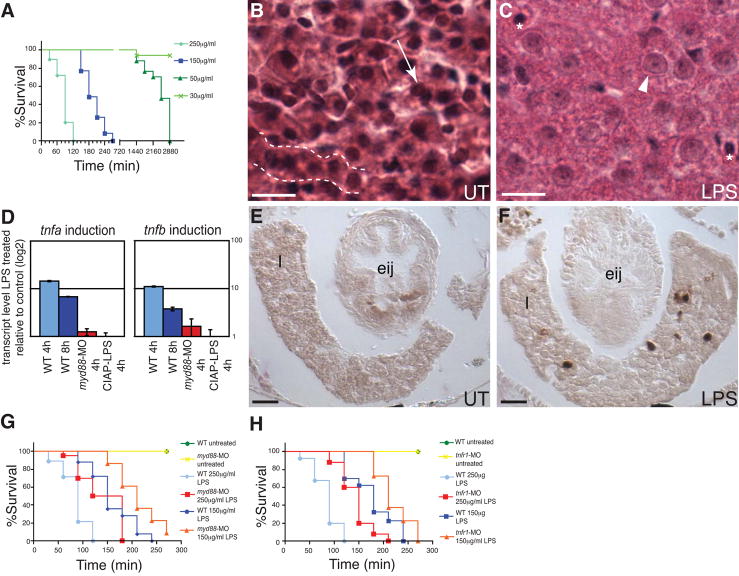
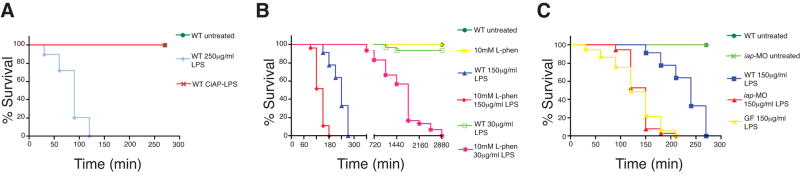
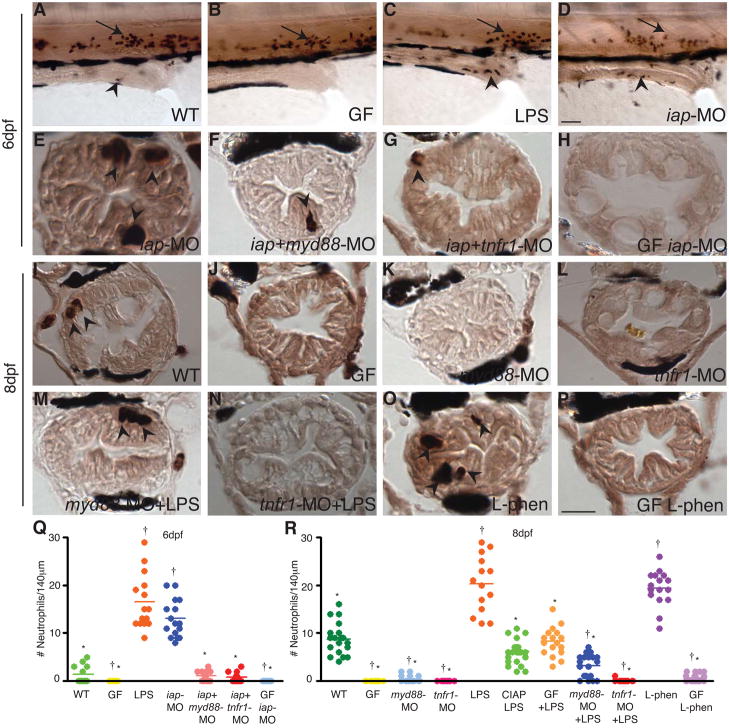
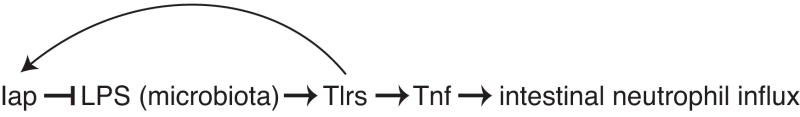
Vertebrates harbor abundant lipopolysaccharide (LPS) in their gut microbiota. Alkaline phosphatases can dephosphorylate and detoxify the endotoxin component of LPS. Here, we show that expression of the zebrafish intestinal alkaline phosphatase (Iap), localized to the intestinal lumen brush border, is induced during establishment of the gut microbiota. Iap-deficient zebrafish are hypersensitive to LPS toxicity and exhibit the excessive intestinal neutrophil influx characteristic of wild-type zebrafish exposed to LPS. Both of these Iap mutant phenotypes are dependent on Myd88 and Tumor Necrosis Factor Receptor (Tnfr), proteins also involved in LPS sensitivity in mammals. When reared germ-free, the intestines of Iap-deficient zebrafish are devoid of neutrophils. Together, these findings demonstrate that the endogenous microbiota establish the normal homeostatic level of neutrophils in the zebrafish intestine through a process involving Iap, Myd88, and Tnfr. Thus, by preventing inflammatory responses, Iap plays a crucial role in promoting mucosal tolerance to resident gut bacteria.


Figures

Figure 1
Figure 1
Iap activity and iap transcription are regulated by LPS. In situ hybridization of iap transcript at 5 days post fertilization (dpf) in (A) a whole mount larva, and (B) a transverse section through the mid intestine (at the point indicated by the arrow in A). The iap specific purple stain is present in the intestinal epithelium (outlined with the dotted line in A) and is distinct from the black pigment cells above and below the digestive tract and the swim bladder (sb) in A. Scale bar in panel A = 100 μm, scale bar in panel B = 5 μm. (C) Semi-quantitative RT-PCR analysis showing iap and alp expression in dissected intestines (I) and carcasses from which intestines were removed (C) of 8 dpf larvae untreated or exposed to 50 μg/ml LPS for 24h. Levels of the housekeeping gene ef1α are shown as an amplification and loading control. (D) AP activity in the carcasses and intestines of 8 dpf untreated CV WT larvae, iap-MO injected larvae or larvae exposure to 10mM L-phen from 5 dpf. † Indicates values that differ significantly as compared to the CV levels of each group (carcass or intestine), P<0.01. (E) AP activity in 5 and 8 dpf intestines from larvae reared CV (solid bars) left untreated, exposed at 5 dpf to 30 μg/ml LPS, or injected at the 1 cell stage with myd88-MO or the control galT-MO, or larvae reared GF (striped bars) left untreated, exposed at 5 dpf to 3 μg/ml LPS, or mono-associated at 5 dpf with a Gram-negative Aeromonas species (G−) or a Gram-positive Streptococcus species (G+). † Indicates values that differ significantly from CV at 8dpf, * indicates values that differ significantly from GF at 8 dpf, P<0.01. For D and E, n=10 dissected intestines/treatment for each trial, with at least 2 trials per treatment. Error bars represent standard deviation. (F) iap transcript levels, measured by qRTPCR, were reduced in 8 dpf GF versus CV animals, and elevated in 8 dpf CV and GF animals exposed for 24h to 30 μg/ml LPS, but not in 8 dpf myd88-MO injected animals reared CV and exposed for 24h to 50 μg/ml LPS. Data are representative of two repeated trials, in which all samples were run in triplicate. Error bars indicate standard deviation. All animals were WT unless otherwise indicated.
Figure 2
Figure 2
LPS toxicity in zebrafish. (A) Dose-dependent killing of wild-type animals exposed to LPS at 6 dpf. Analysis of survival curves show they are significantly different (Logrank test, P<0.0001). (B–C) H&E stained liver sections of untreated (UT) 8 dpf larvae or exposed to 100μg/ml LPS for 24h. (B) Hepatocytes in B show typical organization in cords (dashed line) with distinct nuclei (arrow). (C) LPS treatment resulted in disorganized tissue morphology, with cell boundaries that are difficult to distinguish and swollen hepatocyte nuclei (arrowhead), in contrast to the normal-sized nuclei of red blood cells (asterisks). Scale bar in panel B,C = 5 μm. (D) tnfa and tnfb transcript levels, assayed by qRTPCR, in WT and myd88-MO injected 7 dpf larvae exposed to 50 μg/ml LPS for 4 or 8 h, or WT exposed to 50 μ/ml CIAP treated LPS for 4 h. Data are representative of two repeated trials, in which all samples were run in triplicate. Error bars indicate standard deviation. (E–F) Mpo stained transverse sections of UT 8 dpf larvae or larvae exposed to 150 μg/ml LPS for 2h at the esophageal-intestinal junction (eij). Mpo-positive cells (dark brown) are present in the liver (1) of the LPS exposed animal in F. Scale bar in panel E,F = 10 μm. (G–H) Survival curves of myd88-MO or tnfr1-MO injected 7 dpf larvae exposed to 150 or 250 μg/ml LPS. Survival curves are significantly different (Logrank test, P<0.0001). n = at least 30 total animals for each sample treatment in at least 2 independent trials. All animals were exposed to LPS at 7 dpf except those in panel A, which all began treatment at 6 dpf to allow for 48 h time period to observe toxic effects of low doses of LPS (30–50 μg/ml) prior to termination of all experiments at 8 dpf.
Figure 3
Figure 3
Iap functions to detoxify LPS. (A) LPS pretreated with CIAP was non-toxic to zebrafish at 250 μg/ml LPS, in contrast to mock treated LPS. Inhibition of IAP activity using (B) L-phen, or (C) with iap-MO or by rearing larvae GF, significantly increased susceptibility of larvae to LPS killing. Survival curves are significantly different (except WT untreated and WT CIAP-LPS in A, WT untreated, 10mM L-phen and WT 30 μg/ml LPS in B, and iap-MO 150 μg/ml LPS and GF 150 μg/ml LPS in C, Logrank test, P < 0.0001). All animals were administered LPS at 7 dpf except in panel B, where animals exposed to 30 μg/ml LPS began treatment at 6 dpf. All animals were reared CV, unless otherwise indicated. n = at least 30 total animals for each sample group, in at least two independent trials.
Figure 4
Figure 4
Iap functions to prevent intestinal neutrophil infiltration in response to the microbiota. Whole mount larvae at 6 dpf (A–D) and transverse sections through distal zebrafish intestines at 6 dpf (E–H) and 8 dpf (I–P) with Mpo positive neutrophils visualized in dark brown in the intestinal epithelium (arrowheads) and posterior cardinal vein (arrows); (black cells surrounding the intestinal epithelium are pigment cells.) The WT intestine contained low numbers of neutrophils at 6 (A) and 8 dpf (I), whereas GF intestines were devoid of all neutrophils (B,J). Neutrophil numbers increased significantly upon exposure to 150 μg/ml LPS for 2h (C) or with inhibition of endogenous Iap with iap-MO (D,E) or L-phen (O). Neutrophil infiltration was inhibited in myd88-MO (K) or tnfr1-MO injected larvae (L), even upon exposure to 150 μg/ml LPS for 2h (M–N) or co-injection with iap-MO (F–G). In the absence of microbiota, Iap inhibition did not induce neutrophil influx (H,P). All animals were reared CV unless otherwise indicated. Scale bar in panel D (A–D) = 50 μm, scale bar in panel P (E–P) = 5 μm. (Q–R) Quantification of neutrophils per 140 μm of distal intestine, n = at least 13 animals per treatment; bar indicates average value for each group. † indicates values that differ significantly from WT, * indicates values differ significantly from WT LPS treated, P < 0.01. One-way analysis of variance (ANOVA) show treatments differ significantly, (Q) F = 99.24, P < 0.0001 (R) F = 142.7, P < 0.0001.
Figure 5
Figure 5
A model of Iap function in the intestinal epithelium. Iap is induced by microbiota-associated LPS and dephosphorylates this LPS, thereby establishing a homeostatic negative feedback loop that reduces signaling through Tlrs and Tnf and prevents excessive intestinal inflammation.

Comment in

References

    1. Alpers DH, Zhang Y, Ahnen DJ. Synthesis and parallel secretion of rat intestinal alkaline phosphatase and a surfactant-like particle protein. The American journal of physiology. 1995;268:E1205–1214. - PubMed
    1. Bates JM, Mittge E, Kuhlman J, Baden KN, Cheesman SE, Guillemin K. Distinct signals from the microbiota promote different aspects of zebrafish gut differentiation. Developmental biology. 2006;297:374–386. - PubMed
    1. Bennett CM, Kanki JP, Rhodes J, Liu TX, Paw BH, Kieran MW, Langenau DM, Delahaye-Brown A, Zon LI, Fleming MD, et al. Myelopoiesis in the zebrafish, Danio rerio. Blood. 2001;98:643–651. - PubMed
    1. Berczi I, Bertok L, Bereznai T. Comparative studies on the toxicity of Escherichia coli lipopolysaccharide endotoxin in various animal species. Canadian journal of microbiology. 1966;12:1070–1071. - PubMed
    1. Beumer C, Wulferink M, Raaben W, Fiechter D, Brands R, Seinen W. Calf intestinal alkaline phosphatase, a novel therapeutic drug for lipopolysaccharide (LPS)-mediated diseases, attenuates LPS toxicity in mice and piglets. The Journal of pharmacology and experimental therapeutics. 2003;307:737–744. - PubMed

Publication types

MeSH terms

Substances