. 2008 Jan;48(1):42-54.
doi: 10.1016/j.visres.2007.10.028.

Retinotopy of the face aftereffect

Affiliations

Retinotopy of the face aftereffect

Seyed-Reza Afraz et al. Vision Res. 2008 Jan.

Abstract

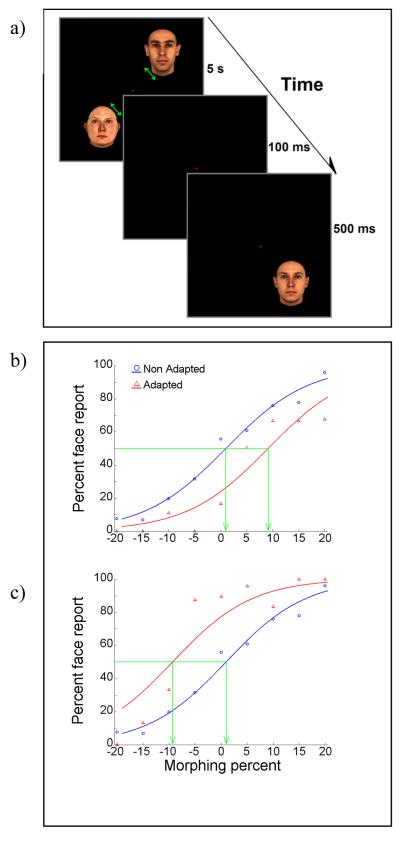
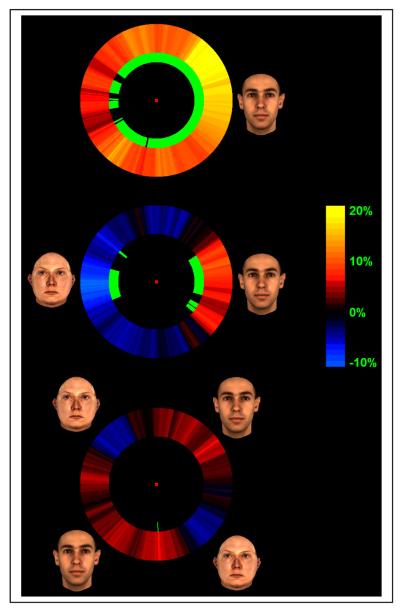
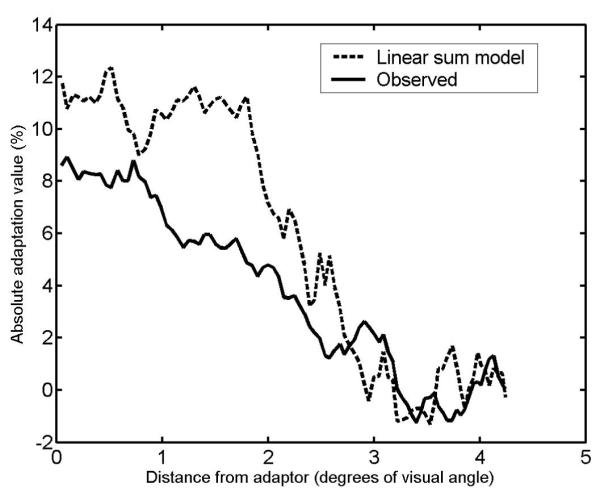
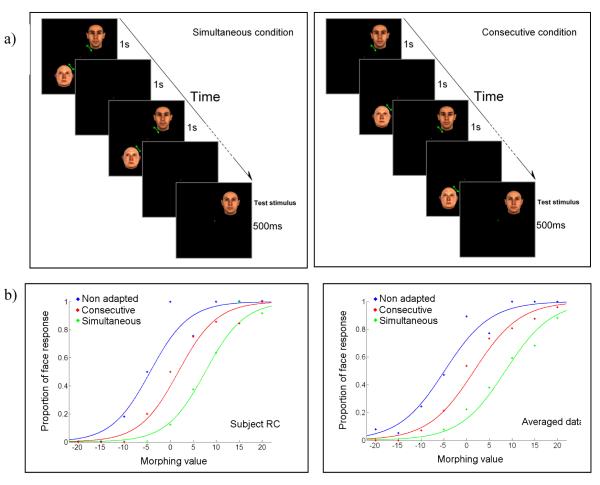
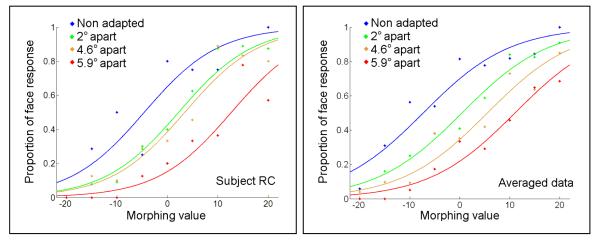
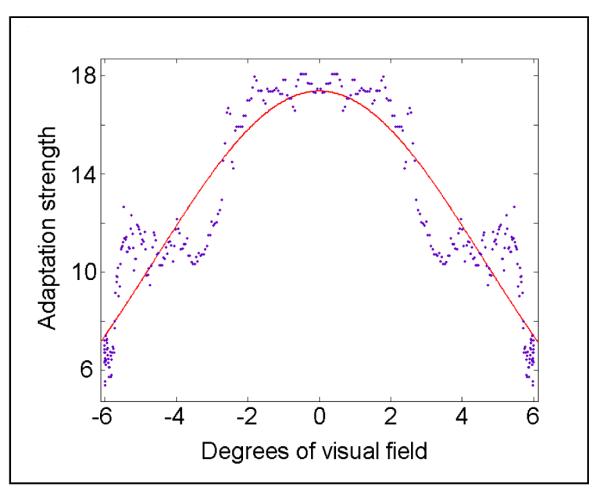
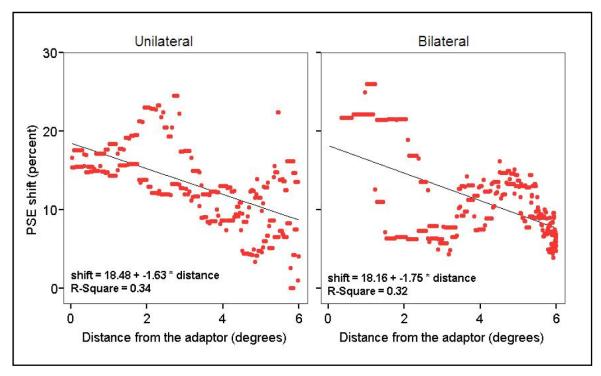
Physiological results for the size of face-specific units in inferotemporal cortex (IT) support an extraordinarily large range of possible sizes--from 2.5 degrees to 30 degrees or more. We use a behavioral test of face-specific aftereffects to measure the face analysis regions and find a coarse retinotopy consistent with receptive fields of intermediate size (10 degrees -12 degrees at 3 degrees eccentricity). In the first experiment, observers were adapted to a single face at 3 degrees from fixation. A test (a morph of the face and its anti-face) was then presented at different locations around fixation and subjects classified it as face or anti-face. The face aftereffect (FAE) was not constant at all test locations--it dropped to half its maximum value for tests 5 degrees from the adapting location. Simultaneous adaptation to both a face and its anti-face, placed at opposite locations across fixation, produced two separate regions of opposite aftereffects. However, with four stimuli, faces alternating with anti-faces equally spaced around fixation, the FAE was greatly reduced at all locations, implying a fairly coarse localization of the aftereffect. In the second experiment, observers adapted to a face and its anti-face presented either simultaneously or in alternation. Results showed that the simultaneous presentation of a face and its anti-face leads to stronger FAEs than sequential presentation, suggesting that face processing has a dynamic nature and its region of analysis is sharpened when there is more than one face in the scene. In the final experiment, a face and two anti-face flankers with different spatial offsets were presented during adaptation and the FAE was measured at the face location. Results showed that FAE at the face location was inhibited more as the distance of anti-face flankers to the face stimulus was reduced. This confirms the spatial extent of face analysis regions in a test with a fixed number of stimuli where only distance varied.


Figures

Figure 1
Figure 1
Face aftereffect in opposite directions: Move your eyes up and down on the three red points on the top row for one minute. Then look down and fixate on the red dot on the bottom row. Do the adjacent test faces look the same? Or does one briefly look more like Bush and the other like Clinton? Most observers report that the test faces look different. Existence of two different aftereffects challenges the concept of a translation invariant aftereffect.
Figure 2
Figure 2
Experiment one. a) An adaptation trial. Stimuli were presented at 3° eccentricity. Adapting stimuli could be 1) a single face; 2) one face and its related anti-face (this condition is shown here); 3) two faces and two anti-faces evenly spaced; 4) oval blank surfaces with the average size and color of face stimuli. On each trial, adapting stimuli were moved slowly back and forth around their initial presentation point during five seconds of adaptation to avoid local afterimages. Following a 100ms delay, a 500ms test stimulus with various possible morphing values was presented at a random location around the display circle. Subjects discriminate it as being face or anti-face in a 2AFC task. b) and c) Sample psychometric functions from the adaptation condition shown in “a”. The abscissa shows different morphing values of the test stimulus. Zero represents the averaged face and positive and negative values correspond to face and anti-face directions respectively. The ordinate indicates the proportion of face choices. Red and blue colors correspond to adapted and non-adapted conditions, respectively. Plot “b” shows the results obtained from the “face” location and “c” illustrates results obtained from the anti-face location. As seen here “b” and “c” show significant (Logistic regression, p<0.05) shifts in the PSE (shown by green arrows) in opposite directions for different parts of the visual field corresponding to the adapting face and anti-face locations respectively.
Figure 3
Figure 3
FAE maps. Each point on the map shows the FAE strength at a location on the display circle relative to the adapting stimulus/stimuli location/s. The amount of FAE strength (shift of the psychometric function) is indicated with the color with red and blue shades corresponding to rightward and leftward PSE shift. Short green sectors on the inner side of the map circle indicate significance of the shift at eat location on the map (logistic regression, p<0.05). Top, middle and bottom maps correspond to the three adaptation conditions and the locations of the adapting stimuli are shown near each map.
Figure 4
Figure 4
The comparison between the observed and expected adaptation value for two adapting faces. The solid line shows the absolute adaptation value after simultaneous adaptation to the face and the anti-face as a function of distance from the adaptor. The dashed line shows the expected data for this comparison based on data obtained from adaptation with a single face (see text for more details).
Figure 5
Figure 5
Simultaneous vs. consecutive adaptation. a) Simultaneous and consecutive adaptation paradigms are shown on the left and right sides respectively. Each stimulus was presented for 5 total seconds at 0.5Hz alternation. b) Proportion of face responses plotted against morphing value in a typical subject (right plot shows this for data averaged over all subjects). Blue, red and green colors correspond to non-adapted, consecutive and simultaneous adapted conditions respectively. The rightward shift of the psychometric function corresponds to FAE strength and is strongest for the simultaneous adaptation condition.
Figure 6
Figure 6
Effect of inter-stimulus distance during adaptation on the FAE. FAE is measured at the adapting face location with anti-face flankers at different separations from the face in the adaptation phase. Blue shows the non-adapted baseline condition and green, brown and red indicate the three spatial separations. The aftereffect at the face location (rightward PSE shift) is much smaller when the flankers are close to the adapting face. Left and right plots show the results for a typical subject and averaged data for all subjects respectively.
Figure 7
Figure 7
Estimation of spatial extent of FAE. PSE shift values, after adaptation to a single face in experiment one are plotted as a function of distance from the adapting stimulus location. Data are mirrored on left and right and fitted with a Gaussian curve. The abscissa shows the distance from the adapting stimulus and the ordinate indicates percent of shift in the psychometric function after adaptation. Half width at half height of the fitted function is 5.4°.
Figure 8
Figure 8
Comparison of the effect of distance on FAE strength in unilateral and bilateral presentations. In both case, increasing the distance between the adapt and test stimuli leads to a similar decrease in FAE.

Similar articles

Cited by

References

    1. Afraz SR, Kiani R, Esteky H. Microstimulation of inferotemporal cortex influences face categorization. Nature. 2006;442(7103):692–5. - PubMed
    1. Anderson ND, Wilson HR. The nature of synthetic face adaptation. Vision Res. 2005;45(14):1815–28. - PubMed
    1. Biederman I, Cooper EE. Evidence for complete translational and reflectional invariance in visual object priming. Perception. 1991;20(5):585–93. - PubMed
    1. Blake R, Fox R. Adaptation to invisible gratings and the site of binocular rivalry suppression. Nature. 1974;249(456):488–90. - PubMed
    1. Blanz V, Vetter T. A morphable model for the synthesis of 3D faces. In: Waggenspack W, editor. 1999 Symposium on Interactive 3D Graphics-Proceedings of SIGGRAPH’99. ACMPress; New York: 1999. pp. 187–194.

Publication types