. 2007 Dec 15;21(24):3319-30.
doi: 10.1101/gad.449407.

Kinetochore microtubule interaction during S phase in Saccharomyces cerevisiae

Affiliations

Kinetochore microtubule interaction during S phase in Saccharomyces cerevisiae

Etsushi Kitamura et al. Genes Dev. .

Abstract

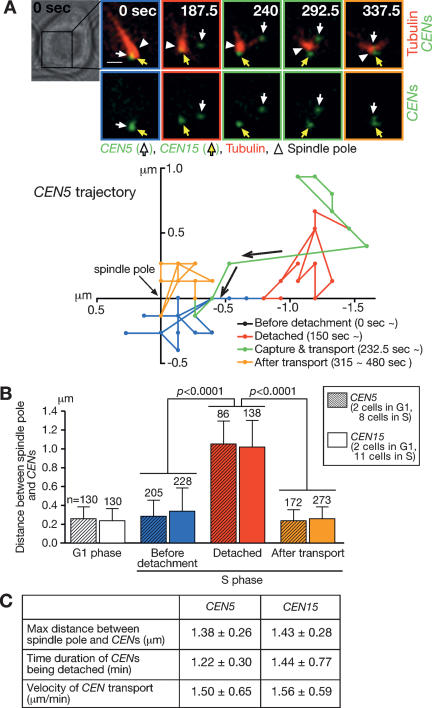
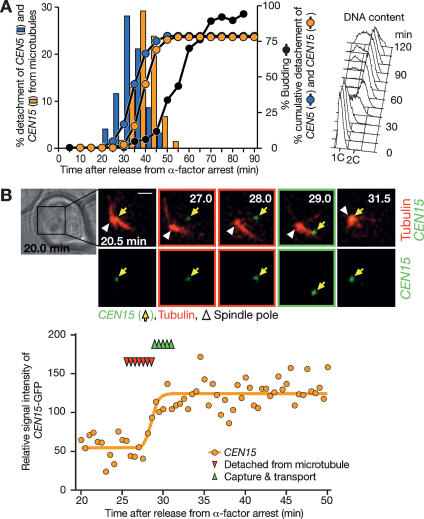
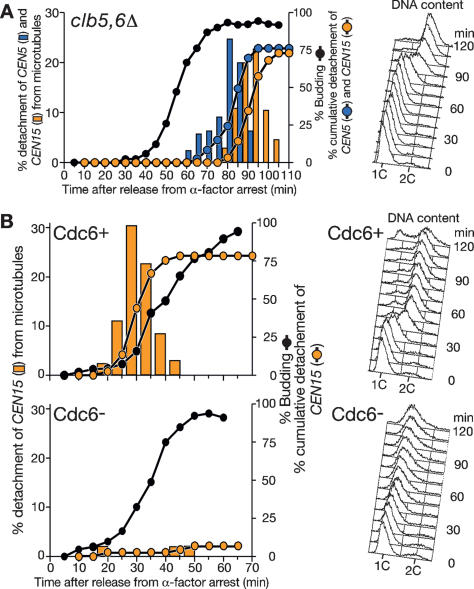
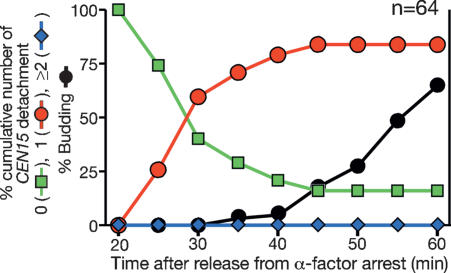
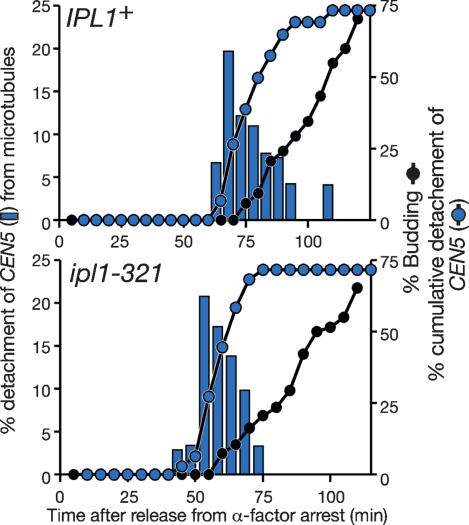
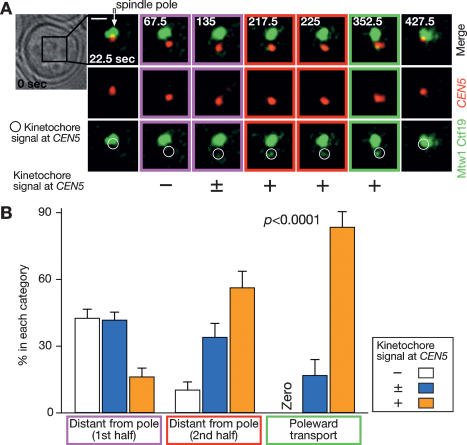
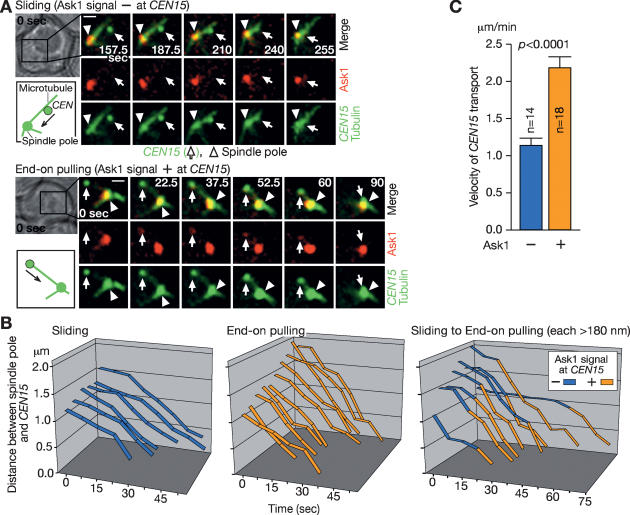
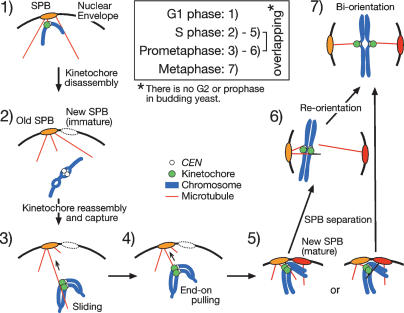
In the budding yeast Saccharomyces cerevisiae, microtubule-organizing centers called spindle pole bodies (SPBs) are embedded in the nuclear envelope, which remains intact throughout the cell cycle (closed mitosis). Kinetochores are tethered to SPBs by microtubules during most of the cell cycle, including G1 and M phases; however, it has been a topic of debate whether microtubule interaction is constantly maintained or transiently disrupted during chromosome duplication. Here, we show that centromeres are detached from microtubules for 1-2 min and displaced away from a spindle pole in early S phase. These detachment and displacement events are caused by centromere DNA replication, which results in disassembly of kinetochores. Soon afterward, kinetochores are reassembled, leading to their recapture by microtubules. We also show how kinetochores are subsequently transported poleward by microtubules. Our study gives new insights into kinetochore-microtubule interaction and kinetochore duplication during S phase in a closed mitosis.


Figures

Figure 1.
Figure 1.
Centromeres are transiently detached from microtubules and are displaced away from a spindle pole during S phase. CEN5-tetOs TetR-3CFP CEN15-lacOs GFP-LacI YFP-TUB1 cells (T4243) were treated with α-factor and subsequently released to fresh medium. After 30 min, CFP/GFP and YFP images were collected every 7.5 sec for 8 min. (A, top) Representative time-lapse images show CEN5 and CEN15 in green and microtubules in red. White arrows, yellow arrows, and white arrowheads indicate CEN5, CEN15, and a spindle pole, respectively. Time is shown in seconds in the montage (0 sec: start of image acquisition). Bar, 1 μm. (Bottom) The trajectory of CEN5 (its position relative to a spindle pole) in the same cell shown at the top is plotted along X- and Y-axes before detachment from microtubules (blue), while being detached (red), after recapture by microtubules/during transport toward a spindle pole (green) and after transport (orange; the same colors were also used to outline frames of the montage on the top). Arrows indicate the direction of CEN5 motion. (B) The distance between CEN5/CEN15 and a spindle pole was measured at each time point in two cells in G1 phase (5–13 min after release from α-factor arrest) and eight and 11 cells in S phase, where CEN5 and CEN15 were detached from microtubules, respectively. “n” denotes the number of time points of measurement. Error bars show SD. P values were obtained by comparing indicated values, separately for CEN5 and CEN15, using an unpaired t-test. (C) For CEN5 and CEN15, their maximum distance from a spindle pole (while CEN was detached from microtubules), duration of CEN detachment, and the velocity of CEN transport (mean ± SD) are shown; the data set obtained in B was analyzed.
Figure 2.
Figure 2.
Centromere detachment from microtubules coincides with its DNA replication. (A) Centromere detachment from microtubules occurs in early S phase. T4243 cells (see legend for Fig. 1) were treated with α-factor and subsequently released to fresh medium. CFP/GFP and YFP images were collected every 7.5 sec using the JP3 filter set (see Materials and Methods). To reduce photobleaching of YFP-Tub1 signals, the field of microscopic observation was changed every 5 min, and the percentage of CEN5 (blue) and CEN15 (orange) detachment was scored during each 5-min interval (bars). The cumulative percentage of CEN detachment is shown as lines. The percentage of cells with buds (line with black dots) and FACS DNA content (right) are also shown. (B) Centromere detachment and its DNA replication are coincidental. CEN15-lacOs GFP-LacI YFP-TUB1 cells (T5276) were treated with α-factor and subsequently released to fresh medium. After 20 min, GFP and YFP images were collected every 30 sec for 30 min. (Top) Representative time- lapse images show CEN15-GFP in green and microtubules in red. Yellow arrows and white arrowheads indicate CEN15 and a spindle pole, respectively. Time indicated on images: minutes after release from α-factor arrest. Bar, 1 μm. (Bottom) The intensity of a CEN15-GFP dot was measured and plotted, and its change was approximated by a regression curve (orange) with the method described previously (Kitamura et al. 2006). Red and green triangles show the time points at which CEN15 was detached from microtubules and subsequently reassociated with them (until its return to the vicinity of a spindle pole by transport), respectively (the same colors were also used to outline frames of the montage on the top).
Figure 3.
Figure 3.
Centromere detachment from microtubules is dependent on DNA replication. (A) The timing of centromere detachment is delayed relative to bud emergence when DNA replication is delayed due to deletion of CLB5,CLB6. clb5Δ clb6Δ CEN5-tetOs TetR-3CFP CEN15-lacOs GFP-LacI YFP-TUB1 cells (T5115) were treated and images were acquired and analyzed as in Figure 2A. Symbols and colors are as in Figure 2A. (B) Cdc6-depleted cells rarely show centromere detachment from microtubules. Pgal-CDC6 cdc6Δ CEN15-lacOs GFP-LacI YFP-TUB1 cells (T5118) were grown in medium containing galactose and raffinose, arrested with nocodazole treatment, released to medium containing glucose and α-factor, then subsequently rereleased to fresh medium containing glucose, as described previously (Severin et al. 2001). Images were acquired and analyzed as in Figure 2A. Symbols and colors are as in Figure 2A.
Figure 4.
Figure 4.
The majority of centromeres show detachment only once during S phase. CEN15-lacOs GFP-LacI GFP-TUB1 cells (T5280) were treated with α-factor and subsequently released to fresh medium. After 20 min, GFP images were collected every 20 sec for 40 min. The colored lines show the percentage of cells with the following cumulative number of CEN15 detachment from microtubules: zero (green), once (red,) and twice or more (blue). The black line shows the percentage of cells with buds.
Figure 5.
Figure 5.
DNA replication causes centromere detachment from microtubules independently of Aurora kinase Ipl1. IPL1+ (T5052) and ipl1-321 (T5429) cells with CEN5-tetOs TetR-3CFP GFP-TUB1 were treated as in Figure 2A, except that temperature for cell culture was shifted to 35°C when cells were released from α-factor arrest. CFP and GFP images were acquired as in Figure 2A, but at 35°C and using the JP4 filter set (see Materials and Methods). Symbols and colors are as in Figure 2A.
Figure 6.
Figure 6.
Transient kinetochore disassembly upon centromere DNA replication. MTW1-4GFP CTF19-4GFP CEN5-tetOs TetR-3CFP cells (T5529) were treated with α-factor and subsequently released to fresh medium. After 25 min, CFP and GFP images were collected every 7.5 sec for 10 min. (A) Representative time-lapse images show CEN5-CFP in red and Mtw1-4GFP/Ctf19-4GFP in green. Time is shown in seconds in the montage (0 sec: start of image acquisition). White arrows and circles indicate the positions of a spindle pole and CEN5, respectively. The intensity of GFP signals at CEN5 was quantified and scored as “−” “±,” and “+,” as described in Materials and Methods. Colors outlining frames of the montage denote categories quantified in B (see below). Bar, 1 μm. (B) The GFP intensity was scored at each time point in 10 individual cells, and the mean (±SE) percentage of the 10 cells for each scoring category was depicted during the following three periods: “distant from pole, 1st half” (purple) and “distant from pole, 2nd half” (red), which equally divided the period of CEN5 being displaced from a spindle pole (CEN5–spindle pole distance >0.7 μm; during which we estimate CEN5 was detached from microtubules), and “poleward transport” (green), during which CEN5 moved toward a spindle pole. The data from each individual cell are shown in Supplementary Figure S3. The P value was obtained by testing the possible difference between the three periods using the GFP signal-intensity data together from the 10 individual cells (rather than the averaged percentages), using Kruskal-Wallis nonparametric test.
Figure 7.
Figure 7.
Lateral sliding and end-on pulling for centromere transport in S phase. ASK1-3CFP CEN15-lacOs GFP-LacI GFP-TUB1 cells (T5363) were treated and CFP and GFP images were collected as in Figure 6. (A) Representative time-lapse images show Ask1-3CFP in red and CEN15-GFP/GFP-Tub1 in green. In the bottom image sequence, the Ask1 signal continuously colocalized, and in the top image sequence it did not. Time is shown in seconds in the montage (0 sec: start of image acquisition). White arrows and arrowheads indicate the positions CEN15 and a spindle pole, respectively. Bar, 1 μm. (B) Graphs show motion of CEN15 in each cell. CEN15–spindle pole distance was plotted as a function of time. “0 sec” indicates the start of CEN15 transport by end-on pulling or sliding. When the Ask1 signal continuously colocalized (orange) or not (blue) with CEN15 while being transported >180 nm, it was scored as CEN15 transport by end-on pulling or sliding, respectively. Note that if CEN15 did not colocalize with Ask1 and did not move >180 nm after it was reassociated with microtubules and before it was transported by end-on pulling (i.e., with Ask1 colocalization), such a phase was not scored as sliding and was not included in these graphs. (C) Graphs showing the velocity (mean ± SE) of CEN15 transport by end-on pulling (orange) or sliding (blue) toward a spindle pole.
Figure 8.
Figure 8.
Summary of kinetochore–microtubule interaction from G1 to metaphase in S. cerevisiae. (Step 1) Kinetochores are attached to microtubules (perhaps to the ends of microtubules; see Supplementary Note 6) in G1. (Step 2) Kinetochores are disassembled upon centromere DNA replication, and centromeres are detached from microtubules and move away from a spindle pole. (Step 3) Kinetochores are reassembled, captured by the lateral surface of microtubules, and transported poleward by sliding along the microtubule surface. (Step 4) Kinetochores are tethered at the ends of microtubules and often further transported poleward as microtubules shrink. (Step 5) Both sister kinetochores interact with microtubules from either the same or different SPBs. (Steps 6, 7) SPBs separate at the end of S phase, and reorientation of kinetochore–microtubule attachment leads to sister kinetochore biorientation.

References

    1. Adams I.R., Kilmartin J.V., Kilmartin J.V. Spindle pole body duplication: A model for centrosome duplication? Trends Cell Biol. 2000;10:329–335. - PubMed
    1. Amberg D.C., Burke D.J., Strathern J.N., Burke D.J., Strathern J.N., Strathern J.N. Methods in yeast genetics. Cold Spring Harbor Laboratory Press; Cold Spring Harbor, NY: 2005.
    1. Biggins S., Severin F.F., Bhalla N., Sassoon I., Hyman A.A., Murray A.W., Severin F.F., Bhalla N., Sassoon I., Hyman A.A., Murray A.W., Bhalla N., Sassoon I., Hyman A.A., Murray A.W., Sassoon I., Hyman A.A., Murray A.W., Hyman A.A., Murray A.W., Murray A.W. The conserved protein kinase Ipl1 regulates microtubule binding to kinetochores in budding yeast. Genes & Dev. 1999;13:532–544. - PMC - PubMed
    1. Blow J.J., Tanaka T.U., Tanaka T.U. The chromosome cycle: Coordinating replication and segregation. Second in the cycles review series. EMBO Rep. 2005;6:1028–1034. - PMC - PubMed
    1. Bornens M. Centrosome composition and microtubule anchoring mechanisms. Curr. Opin. Cell Biol. 2002;14:25–34. - PubMed

Publication types