. 2007 Dec 18;104(51):20546-51.
doi: 10.1073/pnas.0709515104. Epub 2007 Dec 13.

Energetics of neuronal signaling and fMRI activity

Affiliations

Energetics of neuronal signaling and fMRI activity

Natasja J G Maandag et al. Proc Natl Acad Sci U S A. .

Abstract

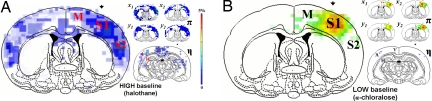
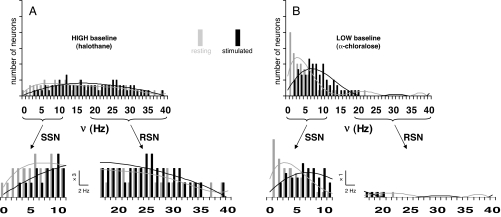
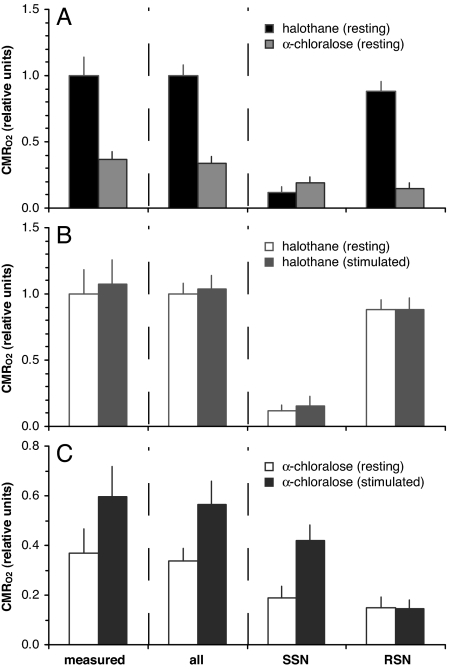
Energetics of resting and evoked fMRI signals were related to localized ensemble firing rates (nu) measured by electrophysiology in rats. Two different unstimulated, or baseline, states were established by anesthesia. Halothane and alpha-chloralose established baseline states of high and low energy, respectively, in which forepaw stimulation excited the contralateral primary somatosensory cortex (S1). With alpha-chloralose, forepaw stimulation induced strong and reproducible fMRI activations in the contralateral S1, where the ensemble firing was dominated by slow signaling neurons (SSN; nu range of 1-13 Hz). Under halothane, weaker and less reproducible fMRI activations were observed in the contralateral S1 and elsewhere in the cortex, but ensemble activity in S1 was dominated by rapid signaling neurons (RSN; nu range of 13-40 Hz). For both baseline states, the RSN activity (i.e., higher frequencies, including the gamma band) did not vary upon stimulation, whereas the SSN activity (i.e., alpha band and lower frequencies) did change. In the high energy baseline state, a large majority of total oxidative energy [cerebral metabolic rate of oxygen consumption (CMR(O2))] was devoted to RSN activity, whereas in the low energy baseline state, it was roughly divided between SSN and RSN activities. We hypothesize that in the high energy baseline state, the evoked changes in fMRI activation in areas beyond S1 are supported by rich intracortical interactions represented by RSN. We discuss implications for interpreting fMRI data where stimulus-specific DeltaCMR(O2) is generally small compared with baseline CMR(O2).


Conflict of interest statement

The authors declare no conflict of interest.

Figures

Fig. 1.
Fig. 1.
fMRI activation maps during forepaw stimulation. The coronal maps are merged maps of single-run fMRI data from five rats to show overlap of averaged activities across subjects. All activation maps were thresholded at approximately the same value (P < 0.02) since the number of images varied slightly across studies. The contralateral side is shown by the arrow. (A) Sensory-induced activation maps with halothane showed activations in many regions, which included the primary (S1) and secondary (S2) somatosensory cortices and the primary and secondary motor (M) regions, as well as some lateral regions of the hippocampus (H) and some secondary area of the visual (V) and auditory (A) cortices (see η map, Inset). The contralateral S1 activity was stronger than in activations in other areas. (B) Sensory-induced activation maps with α-chloralose showed robust localized activations within the contralateral S1, with weaker activities within the contralateral S2 and M and no significant activations elsewhere (see η map in inset). (Insets) The π maps (anterior coronal slice) are single-run fMRI activation maps from two rats (i.e., subjects x and y) in two consecutive experiments to show reproducibility in S1, S2, and M areas. The x1 and x2 maps in A are from two runs from subject x under halothane, whereas the x3 and x4 maps in B are from two runs under α-chloralose from the same subject x. Similar data are shown for subject y. The η maps (posterior coronal slice) are merged maps of single-run fMRI activation maps from two rats (i.e., subjects x and y) to show overlap of averaged activities in V, A, and H across subjects. Other activated regions not shown are thalamus and perirhinal cortex (observed mainly under halothane). Refer to SI Table 2 for other details.
Fig. 2.
Fig. 2.
Total activity represented by distribution of firing rate (ν; 10-s bins) in the S1 neuronal ensemble. By grouping the averaged firing rate for a given epoch (i.e., resting or stimulated period) from all recordings in the study, histograms were created to represent the behavior of the ensemble which comprised of 184 neurons. Activities of the same ensemble in the contralateral S1 are shown for resting (gray) and stimulated (black) conditions in the (A) high (halothane) and (B) low (α-chloralose) energy baseline states. Changes in the histograms are shown for the widespread firing rate distributions of the entire population (Upper; same vertical scales in A and B) and partitioned firing rate distributions (Lower; different vertical scales in A and B) revealing the slow and rapid signaling neurons, respectively (i.e., SSN and RSN). Refer to Table 1 and SI Fig. 5 for details.
Fig. 3.
Fig. 3.
Total energy demand (CMRO2) in the S1 neuronal ensemble. Comparisons of energetic costs among (A) resting states under halothane and α-chloralose anesthesia, (B) halothane anesthesia at rest and during stimulation, and (C) α-chloralose anesthesia at rest and during stimulation. Data for the “measured” columns were estimated from 2-deoxyglucose autoradiography and/or NMR measurements (see Materials and Methods). Data for other columns were calculated from the histograms in Fig. 2 using Eq. 1. The “all” columns were calculated by integrating the firing rate for each neuron for all neurons in the ensemble, whereas the “SSN” and “RSN” columns were calculated by integrating only the firing rate for the SSN and RSN portions of the ensemble, respectively. Refer to Table 1 for details. In all cases, good agreement was found between the “measured” and “all” columns. Partitioning of energetic cost between SSN and RSN portions of the ensemble suggests significantly different contributions under halothane and α-chloralose anesthesia. Energetic cost of RSN activity was almost unaffected by stimulation, whereas the SSN activity was more responsive to stimulation.

References

    1. Hyder F, Patel AB, Gjedde A, Rothman DL, Behar KL, Shulman RG. J Cereb Blood Flow Metab. 2006;26:865–877. - PubMed
    1. Shulman RG, Rothman DL, Behar KL, Hyder F. Trends Neurosci. 2004;27:489–495. - PubMed
    1. Hyder F. Stroke. 2004;35(Suppl I):33–39.
    1. Buzsaki G, Draguhn A. Science. 2004;304:1926–1929. - PubMed
    1. Buzsaki G. Rhythms of the Brain. New York: Oxford Univ Press; 2006.

Publication types