. 2008 Apr 1;177(7):730-42.
doi: 10.1164/rccm.200708-1233OC. Epub 2007 Dec 13.

Development of chronic bronchitis and emphysema in beta-epithelial Na+ channel-overexpressing mice

Affiliations

Development of chronic bronchitis and emphysema in beta-epithelial Na+ channel-overexpressing mice

Marcus A Mall et al. Am J Respir Crit Care Med. .

Abstract

Rationale: Chronic obstructive pulmonary disease is a leading cause of death worldwide, but its pathogenesis is not well understood. Previous studies have shown that airway surface dehydration in beta-epithelial Na(+) channel (betaENaC)-overexpressing mice caused a chronic lung disease with high neonatal pulmonary mortality and chronic bronchitis in adult survivors.

Objectives: The aim of this study was to identify the initiating lesions and investigate the natural progression of lung disease caused by airway surface dehydration.

Methods: Lung morphology, gene expression, bronchoalveolar lavage, and lung mechanics were studied at different ages in betaENaC-overexpressing mice.

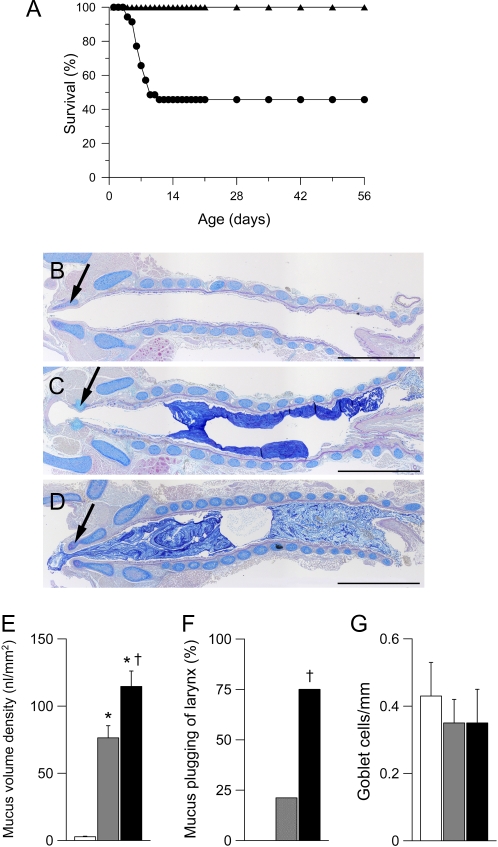
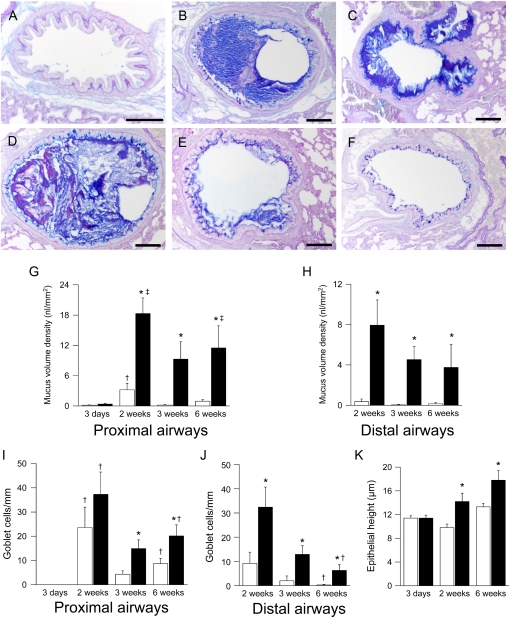
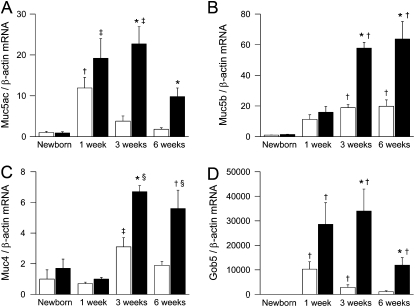
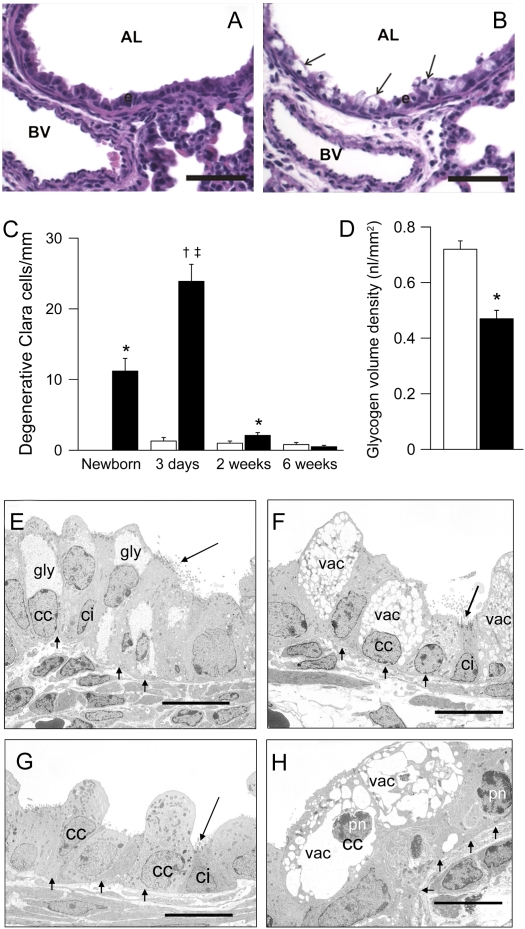
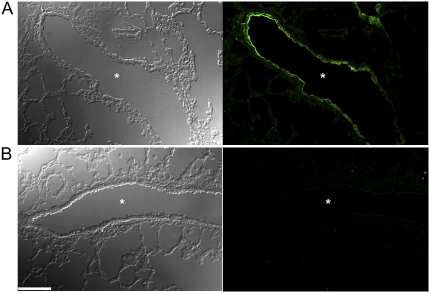
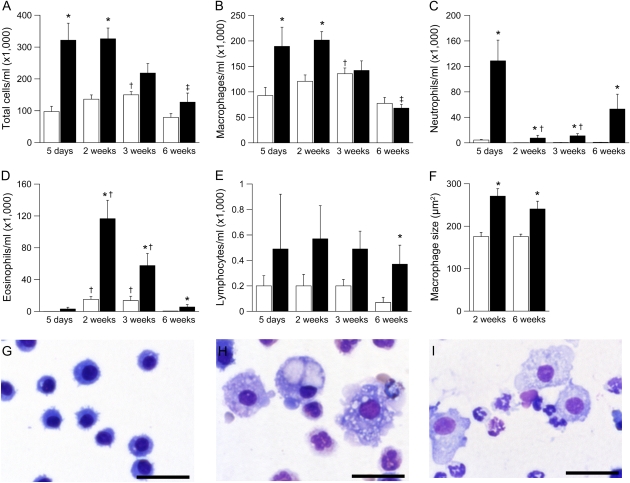
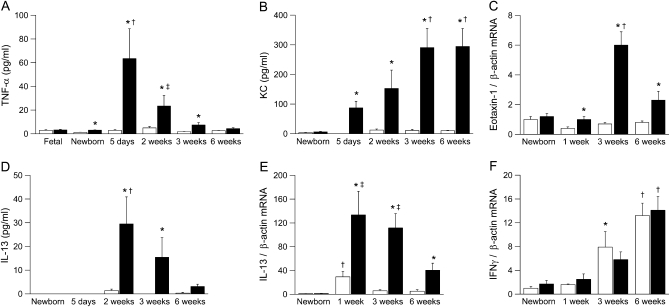
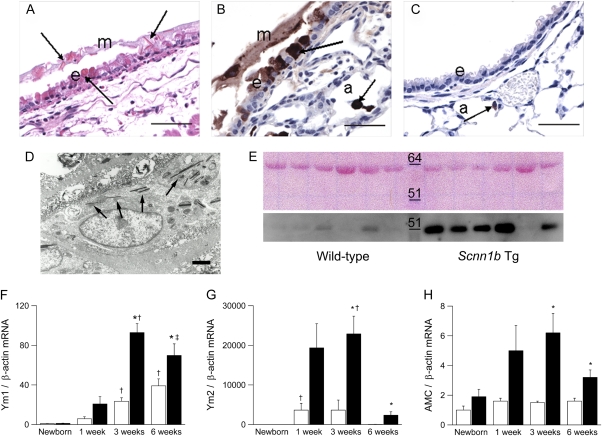
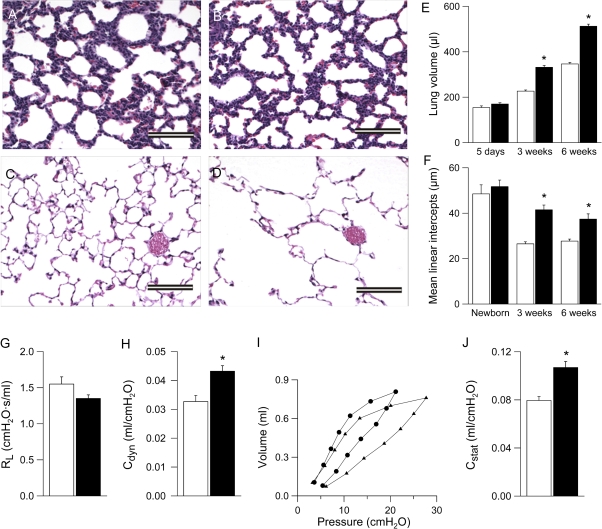
Measurements and main results: Mucus obstruction in betaENaC-overexpressing mice originated in the trachea in the first days of life and was associated with hypoxia, airway epithelial necrosis, and death. In surviving betaENaC-overexpressing mice, mucus obstruction extended into the lungs and was accompanied by goblet cell metaplasia, increased mucin expression, and airway inflammation with transient perinatal increases in tumor necrosis factor-alpha and macrophages, IL-13 and eosinophils, and persistent increases in keratinocyte-derived cytokine (KC), neutrophils, and chitinases in the lung. betaENaC-overexpressing mice also developed emphysema with increased lung volumes, distal airspace enlargement, and increased lung compliance.

Conclusions: Our studies demonstrate that airway surface dehydration is sufficient to initiate persistent neutrophilic airway inflammation with chronic airways mucus obstruction and to cause transient eosinophilic airway inflammation and emphysema. These results suggest that deficient airway surface hydration may play a critical role in the pathogenesis of chronic obstructive pulmonary diseases of different etiologies and serve as a target for novel therapies.


Figures

<b>Figure 1.</b>
Figure 1.
Pulmonary mortality and tracheal mucus obstruction in β-epithelial Na+ channel (βENaC)–overexpressing mice. (A) Survival curves from βENaC-overexpressing mice (circles; n = 35) and wild-type littermates (triangles; n = 36). (B–D) Histology (Alcian blue periodic acid-Schiff) of tracheae from wild-type (B) and βENaC-overexpressing mice (C) killed at the age of 3 days and a βENaC-overexpressing mouse that died spontaneously at 4 days (D). Larynx is indicated by arrows. Scale bars, 1,000 μm. Representative for n = 6–14 mice per group. (E–G) Summary of tracheal mucus content as determined from volume density measurements (E), frequency of laryngeal mucus plugging (F), and goblet cell counts (G) in tracheae from wild-type (open bars), βENaC-overexpressing mice killed at 3 days (shaded bars), and βENaC-overexpressing mice that died spontaneously at the ages of 3 to 7 days (solid bars). n = 11 – 16 mice per group. *P < 0.001 versus wild-type. P < 0.01 versus killed βENaC-overexpressing mice.
<b>Figure 2.</b>
Figure 2.
Development of airway mucus obstruction, goblet cell metaplasia, and epithelial hyperplasia in β-epithelial Na+ channel (βENaC)–overexpressing mice. (A–D) Lung histology (Alcian blue periodic acid-Schiff) from βENaC-overexpressing mice that were killed at 3 days (A), 2 weeks (B, C), and 6 weeks (D, E) of age and from a 2-week-old wild-type control mouse (F). Lungs were sectioned at the level of the proximal (B, D) main axial airway and from the distal axial airway (E, F). Scale bars, 100 μm. Representative for n = 6–14 mice per group. (G–K) Summary of airway mucus obstruction, goblet cell counts, and epithelial height in bronchi from wild-type (open bars) and βENaC-overexpressing mice (solid bars) at 3 days, 2 weeks, 3 weeks, and 6 weeks of age. n = 6–10 mice per group. (G) Mucus content in proximal main axial airways. *P < 0.01 versus littermate control mice at same age; P < 0.05 versus 3-day-old and 3-week-old wild-type mice; P < 0.05 versus 3-day-old βENaC-overexpressing mice. (H) Mucus content in distal axial airways. *P < 0.05 versus wild-type mice of same age. (I) Goblet cell counts in proximal main axial airways. *P < 0.05 versus wild-type mice of same age; P < 0.05 versus 3-day-old mice of same genotype. (J) Goblet cell counts in distal axial airways. *P < 0.02 versus wild-type mice of same age; P < 0.05 versus 2-week-old mice of same genotype. (K) Epithelial height in lobar bronchi. *P < 0.02 versus wild-type mice.
<b>Figure 3.</b>
Figure 3.
Time course of airway mucin expression in β-epithelial Na+ channel (βENaC)–overexpressing mice. (AD) Transcripts levels of Muc5ac, Muc5b, Muc4, and Gob5 in lungs from wild-type (open bars) and βENaC-overexpressing (solid bars) mice at birth, 1 week, 3 weeks, and 6 weeks of age. Data are expressed as fold changes from newborn wild-type mice. n = 6–14 mice per group. (A) Muc5ac. *P < 0.001 versus littermate control mice at same age; P < 0.05 versus newborn, 3-week-old, and 6-week-old wild-type mice; P < 0.05 versus newborn βENaC-overexpressing mice. (B) Muc5b. *P < 0.01 versus wild-type mice of same age; P < 0.05 versus newborn mice of same genotype. (C) Muc4. *P < 0.001 versus wild-type mice of same age; P < 0.05 versus wild-type mice of same age; P < 0.05 versus newborn and 1-week-old wild-type mice; §P < 0.05 versus 1-week-old βENaC-overexpressing mice. (D) Gob5 expression. *P < 0.05 versus wild-type mice of same age; P < 0.05 versus newborn mice of same genotype.
<b>Figure 4.</b>
Figure 4.
Epithelial degeneration and necrosis in airways of neonatal β-epithelial Na+ channel (βENaC)–overexpressing mice. (A, B) Histology (hematoxylin and eosin) of bronchi from 3-day-old wild-type (A) and βENaC-overexpressing (B) mice showing hydropic degeneration of airway epithelial cells in βENaC-overexpressing mice (arrows). AL = airway lumen; BV = blood vessel; scale bars, 50 μm. (C) Time course of degenerative Clara cells in bronchi of wild-type (open bars) and βENaC-overexpressing (solid bars) mice at birth, 3 days, 2 weeks, and 6 weeks of age. n = 4–12 mice per group. *P < 0.05 versus wild-type mice of same age; P < 0.001 versus wild-type mice of same age; P < 0.05 versus newborn, 2-week-old, and 6-week-old βENaC-overexpressing mice. (D) Reduced epithelial glycogen, as determined by volume density measurements of periodic acid-Schiff–positive glyconen in newborn βENaC-overexpressing (solid bars) compared with wild-type (open bars) mice. n = 4–5 mice per group. *P < 0.001 versus littermate control mice. (E–H) Transmission electron microscopy of airway epithelia in bronchi from newborn (E, F) and 3-day-old (G, H), wild-type (E, G), and βENaC-overexpressing mice (F, H). (F) Loss of intracellular glycogen (gly) and endoplasmatic reticulum vacuolarization (vac) in Clara cells (cc) but not in ciliated cells (ci) from newborn βENaC-overexpressing mice. (H) Pyknotic nuclei (pn) as a sign of necrosis in Clara cells from 3-day-old βENaC-overexpressing mice. Scale bars, 10 μm. Representative for n = 4–12 mice per group.
<b>Figure 5.</b>
Figure 5.
Hypoxia of airway epithelia in neonatal β-epithelial Na+ channel (βENaC)-overexpressing mice. Tissue hypoxia was determined by injection of 3-day-old neonatal mice with the hypoxia probe pimonidazole hydrochloride, and subsequent immunostaining of lung sections with an antibody that detects the probe in hypoxic cells and evaluation by confocal microscopy. Images depict differential interference contrast microscopy (DIC) (left panels) and fluorescein isothiocyanate planes (right panels) of lung sections from βENaC-overexpressing (A) and wild-type (B) mice. Specific immunoreactive signals were observed in the epithelial cells lining the airways of βENaC-overexpressing mice, but not in wild-type lungs (right panels). Asterisks indicate the position of the airway lumen. Scale bar, 100 μm.
<b>Figure 6.</b>
Figure 6.
Development of airway inflammation in β-epithelial Na+ channel (βENaC)-overexpressing mice. (AE) Bronchoalveolar lavage cell counts from wild-type (open bars) and βENaC-overexpressing (solid bars) mice at 5 days, 2 weeks, 3 weeks, and 6 weeks of age. n = 7–20 mice per group. (A) Total cells. *P < 0.001 versus wild-type mice of same age; P < 0.05 versus 5-day-old and 6-week-old wild-type mice; P < 0.05 versus 5-day-old and 2-week-old βENaC-overexpressing mice. (B) Macrophages. *P < 0.01 versus wild-type mice of same age; P < 0.05 versus 5-day-old and 6-week-old wild-type mice; P < 0.05 versus 5-day-old, 2-week-old, and 3-week-old βENaC-overexpressing mice. (C) Neutrophils. *P < 0.001 versus wild-type mice of same age; P < 0.05 versus 5-day-old βENaC-overexpressing mice. (D) Eosinophils. *P < 0.001 versus wild-type mice of same age; P < 0.05 versus 5-day-old and 6-week-old mice of same genotype. (E) Lymphocytes. *P = 0.02 versus wild-type mice of same age. (F–I) Bronchoalveolar macrophages were enlarged (F) and morphologically activated in 2-week-old (H) and 6-week-old (I) βENaC-overexpressing mice compared with wild-type littermates (G) (May-Grünwald-Giemsa staining; scale bars, 50 μm). *P < 0.01 versus littermate control mice.
<b>Figure 7.</b>
Figure 7.
Time course of expression of proinflammatory cytokines in lungs from β-epithelial Na+ channel (βENaC)-overexpressing mice. (AF) Expression of tumor necrosis factor (TNF)-α, keratinocyte-derived cytokine (KC), eotaxin-1, IL-13, and IFN-γ protein and mRNA in bronchoalveolar lavage and lung homogenates from fetal, newborn, 5-day-old, 2-week-old, 3-week-old, and 6-week-old wild-type (open bars) and βENaC-overexpressing (solid bars) mice. Data are expressed as absolute protein concentrations or fold changes of transcript expression normalized newborn wild-type mice. n = 5–13 mice per group. (A) TNF-α. *P < 0.01 versus wild-type mice of same age; P < 0.05 versus newborn βENaC-overexpressing mice; P < 0.05 versus fetal and newborn βENaC-overexpressing mice. (B) KC. *P < 0.01 versus wild-type mice of same age; P < 0.05 versus newborn βENaC-overexpressing mice. (C) Eotaxin-1 mRNA. *P < 0.01 versus wild-type mice of same age; P < 0.05 versus newborn and 1-week-old wild-type mice. (D) IL-13. *P < 0.05 versus wild-type mice of same age; P < 0.05 versus newborn and 5-day-old, βENaC-overexpressing mice. (E) IL-13 mRNA. *P < 0.05 versus wild-type mice of same age; P < 0.05 versus newborn and 6-week-old wild-type mice; P < 0.05 versus newborn βENaC-overexpressing mice. (F) IFN-γ mRNA. *P < 0.05 versus newborn wild-type mice; P < 0.05 versus newborn and 1-week-old mice of same genotype.
<b>Figure 8.</b>
Figure 8.
Pulmonary expression of chitinases in β-epithelial Na+ channel (βENaC)-overexpressing mice. (A) Eosinophilic crystals in airway epithelium and overlying mucus and intracytoplasmatic material in nonciliated epithelial cells (arrows) in a large-diameter main axial airway from a βENaC-overexpressing mouse (hematoxylin and eosin). e = Epithelium; m = mucus, scale bar, 50 μm. (B, C) Immunolocalization with polyclonal antibody for Ym1 showing strong Ym1 staining in airway mucus, nonciliated epithelial cells, and alveolar macrophages (arrows) of βENaC-overexpressing mice (B). a = Alveoli. (C) In wild-type mice, weak Ym1-positive staining was limited to alveolar macrophages (arrow). Scale bars, 25 μm. (D) Transmission electron microscopy of a macrophage in the airway lumen from a βENaC-overexpressing mouse containing intracellular electron-dense crystals (arrows). Scale bar, 2.5 μm. (E) Western blot for AMCase in bronchoalveolar lavage from wild-type and βENaC-overexpressing mice. Upper panel: Membrane stained with Ponceau S to control for equivalent loading (∼60 kD band likely represents albumin). Lower panel: AMCase (molecular weight ∼52 kD) is more abundant in bronchoalveolar lavage fluid from βENaC-overexpressing mice than in wild-type littermates. Representative for n = 6–8 mice per group. (FH) Expression levels of Ym1, Ym2, and AMCase transcripts in lungs from wild-type (open bars) and βENaC-overexpressing (solid bars) mice at birth, 1 week, 3 weeks, and 6 weeks of age. Data are expressed as fold changes from newborn wild-type mice. n = 6–14 mice per group. (F) Ym1 mRNA. *P < 0.05 versus wild-type mice of same age; P < 0.05 versus newborn and 1-week-old mice of same genotype; P < 0.05 versus newborn βENaC-overexpressing mice. (G) Ym2 mRNA. *P < 0.001 versus wild-type mice of same age; P < 0.05 versus newborn and 6-week-old mice of same genotype. (H) AMCase mRNA. *P < 0.01 versus wild-type mice of same age.
<b>Figure 9.</b>
Figure 9.
Development of emphysema in β-epithelial Na+ channel (βENaC)-overexpressing mice. (AD) Lung histology (hematoxylin and eosin) from newborn (A, B) and 6-week-old (C, D) wild-type (A, C), and βENaC-overexpressing (B, D) mice. Scale bars, 100 μm. (E, F) Lung volume (E) and mean linear intercepts (F) in neonatal to adult βENaC-overexpressing mice (solid bars) and wild-type control mice (open bars). n = 5–12 mice per group. *P < 0.001 versus wild-type mice of same age. (G) Pulmonary resistance (RL), (H) dynamic compliance (Cdyn), (I) pressure–volume curves, and (J) static compliance (Cstat) were measured in adult βENaC-overexpressing mice (solid bars in G, H, and J; circles in I) and littermate control mice (open bars in G, H, and J; triangles in I). n = 8–14 mice per group. *P < 0.001 versus littermate control mice.

References

    1. Kerem B, Rommens JM, Buchanan JA, Markiewicz D, Cox TK, Chakravarti A, Buchwald M, Tsui LC. Identification of the cystic fibrosis gene: genetic analysis. Science 1989;245:1073–1080. - PubMed
    1. Welsh MJ, Ramsey BW, Accurso F, Cutting GR. Cystic fibrosis. In: Scriver CR, Beaudet AL, Sly WS, and Valle D, editors. The metabolic and molecular bases of inherited disease, 8th ed. New York: McGraw-Hill; 2001. pp. 5121–5188.
    1. Anderson MP, Gregory RJ, Thompson S, Souza DW, Paul S, Mulligan RC, Smith AE, Welsh MJ. Demonstration that CFTR is a chloride channel by alteration of its anion selectivity. Science 1991;253:202–205. - PubMed
    1. Canessa CM, Schild L, Buell G, Thorens B, Gautschl I, Horisberger JD, Rossier BC. Amiloride-sensitive epithelial Na+ channel is made of three homologous subunits. Nature 1994;367:463–467. - PubMed
    1. Stutts MJ, Canessa CM, Olsen JC, Hamrick M, Cohn JA, Rossier BC, Boucher RC. CFTR as a cAMP-dependent regulator of sodium channels. Science 1995;269:847–850. - PubMed

Publication types

Substances