. 2007 Nov;3(11):e201.
doi: 10.1371/journal.pgen.0030201. Epub 2007 Oct 2.

AGEMAP: a gene expression database for aging in mice

Affiliations

AGEMAP: a gene expression database for aging in mice

Jacob M Zahn et al. PLoS Genet. 2007 Nov.

Abstract

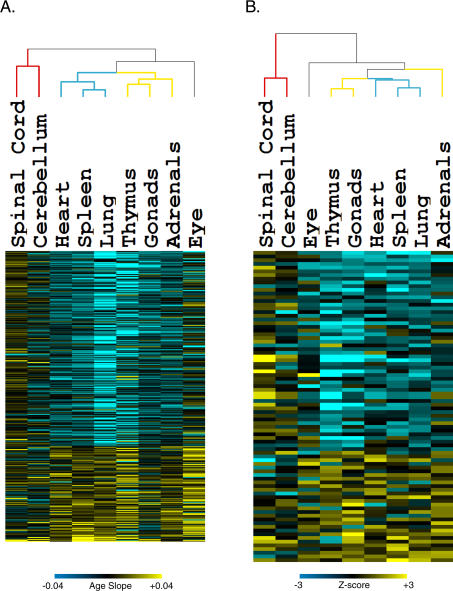
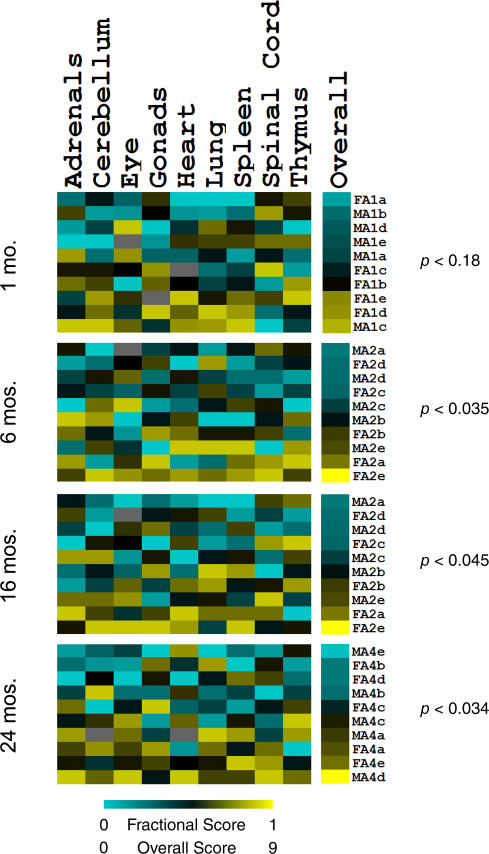
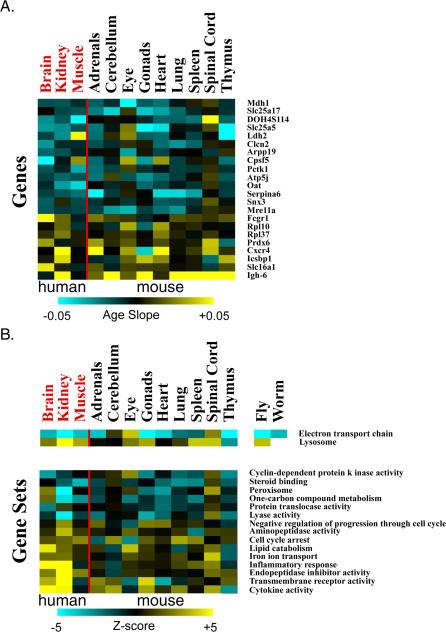
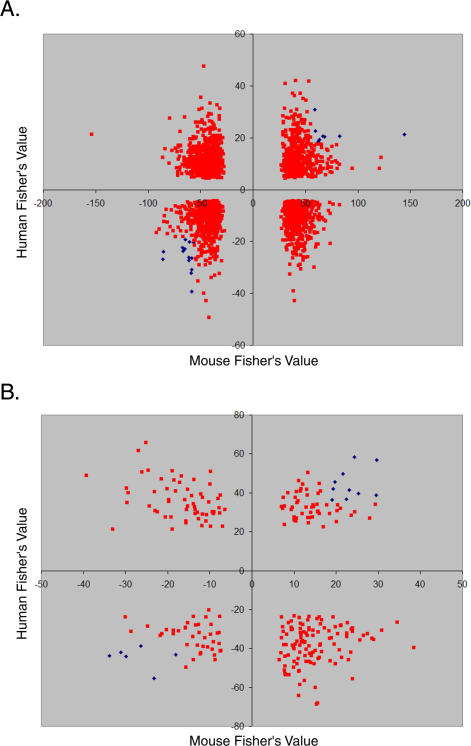
We present the AGEMAP (Atlas of Gene Expression in Mouse Aging Project) gene expression database, which is a resource that catalogs changes in gene expression as a function of age in mice. The AGEMAP database includes expression changes for 8,932 genes in 16 tissues as a function of age. We found great heterogeneity in the amount of transcriptional changes with age in different tissues. Some tissues displayed large transcriptional differences in old mice, suggesting that these tissues may contribute strongly to organismal decline. Other tissues showed few or no changes in expression with age, indicating strong levels of homeostasis throughout life. Based on the pattern of age-related transcriptional changes, we found that tissues could be classified into one of three aging processes: (1) a pattern common to neural tissues, (2) a pattern for vascular tissues, and (3) a pattern for steroid-responsive tissues. We observed that different tissues age in a coordinated fashion in individual mice, such that certain mice exhibit rapid aging, whereas others exhibit slow aging for multiple tissues. Finally, we compared the transcriptional profiles for aging in mice to those from humans, flies, and worms. We found that genes involved in the electron transport chain show common age regulation in all four species, indicating that these genes may be exceptionally good markers of aging. However, we saw no overall correlation of age regulation between mice and humans, suggesting that aging processes in mice and humans may be fundamentally different.


Conflict of interest statement

Competing interests. The authors have declared that no competing interests exist.

Figures

Figure 1
Figure 1. Genes and Gene Sets That Are Commonly Age Regulated in Multiple Tissues
(A) Rows indicate individual genes, arranged from the gene that exhibits the greatest increase in expression with age across multiple tissues at top, to the gene that shows the greatest decrease in expression with age in multiple tissues at bottom. Each column corresponds to an individual mouse tissue. Scale corresponds to the slope of the change in log2 expression with age (β1j). Dendrogram colors indicate affiliation with either the neural (red), vascular (blue), or steroid-responsive (yellow) tissue groups. (B) Rows indicate individual gene sets, arranged from the gene set increasing expression most on average with age in multiple tissues at top, to the most decreasing with age. Each column corresponds to an individual mouse tissue. Scale is the van der Waerden Z-value as determined by gene set enrichment analysis. Dendrogram colors indicate affiliation with either the neural (red), vascular (blue), or steroid-responsive (yellow) tissue groups. A navigable version of this figure exists at http://cmgm.stanford.edu/~kimlab/aging_mouse.
Figure 2
Figure 2. Differences in Age Regulation among Steroid-Responsive, Neural, and Vascular Tissues
Columns refer to tissues, and rows correspond to gene sets. Vertical red bars divide tissues into neural, vascular, and steroid-responsive tissue groups from left to right. Tissue names are colored to indicate affiliation with either neural (red), vascular (blue), or steroid-responsive (yellow) tissue groups. Horizontal red bars divide gene sets into those chosen for being particularly age-regulated in steroid-responsive, neural, or vascular tissues (p-value < 0.001, all |Z| > 1.0, p-value > 0.5 in remaining two tissue groups) from top to bottom. Scale indicates van der Waerden Z-scores as determined by Gene Set Enrichment Analysis. A navigable version of this figure is available at http://cmgm.stanford.edu/~kimlab/aging_mouse.
Figure 3
Figure 3. Coordinate Aging among Tissues in Individual Mice
Columns refer to tissues. The rightmost column refers to the sum of fractional scores for each mouse. Rows refer to individual mice. Identification of individual mice indicates sex (M or F), age (A1 to A4), and biological repeat (a to e); e.g., FA1a is female mouse, age 1 mo, biological repeat a. Scale of tissue columns indicates the fractional score of that individual mouse with its tissue and age cohort; a low fractional score corresponds to a mouse that expresses age-regulated genes as a younger mouse, while a high fractional score expresses age-regulated genes as an older mouse. All fractional scores are summed for each mouse; the result is the overall score shown in the overall column. A low overall score corresponds to a mouse that expresses age-regulated genes as a younger mouse, while a high overall score denotes a mouse expressing age-regulated genes as an older mouse. Each p-value listed indicates the significance of tissue-coordinated aging for that age cohort.
Figure 4
Figure 4. Common Age Regulation in Human, Mice, Flies, and Worms
(A) Comparison of age-related expression changes for 2,578 orthologous genes in humans, mice, flies, and worms. Rows correspond to genes, arranged from the genes showing the greatest decrease in expression with age in both human and mouse at top to the genes showing the greatest increase in expression with age in both human and mouse at bottom. Columns correspond to tissues; tissue names are colored to denote their species of origin, either human (red) or mouse (black). Scale corresponds to the slope of the change in log2 expression with age (β1j). (B) Comparison of age-related expression changes for 280 gene sets in humans, mice, flies, and worms. First row is the mitochondrial electron transport chain gene set, which was found to be age regulated in flies and worms in addition to mammals. Second row is the lysosome gene set, which was found to be age regulated in flies in addition to mammals. Other rows correspond to gene groups that are commonly age related in humans and mice alone. Scale refers to a Van der Waerden Z-score. Columns correspond to tissues; tissue names are colored to denote their species of origin, either human (red) or mouse (black). A navigable version of this figure exists at http://cmgm.stanford.edu/~kimlab/aging_mouse.
Figure 5
Figure 5. No Overall Correlation of Age-Regulated Expression Changes between Mouse and Human
(A) Comparison of age-related expression changes for 2,578 orthologous genes in mouse and human. The y-axis indicates empirical meta-analysis Z-score for three human tissues (muscle, kidney, and brain). The x-axis shows the Fisher's meta-analysis value for nine age-regulated mouse tissues. Each gene had a Z-value for coordinated increases with age across tissues and another for coordinated decreases. We plot the more significant of the two here. Blue diamonds show genes that are age regulated to p < 0.01 in both human and mouse (p < 0.0001 overall). Red squares show all other genes. (B) Comparison of age-related expression changes for 280 gene sets in mouse and human. The x- and y-axes are as in A. Blue diamonds show gene sets that are age regulated to p < 0.01 in both human and mouse (p < 0.0001 overall). Red squares show all other gene sets.

Similar articles

Cited by

References

    1. Lee CK, Klopp RG, Weindruch R, Prolla TA. Gene expression profile of aging and its retardation by caloric restriction. Science. 1999;285:1390–1393. - PubMed
    1. Lee CK, Weindruch R, Prolla TA. Gene-expression profile of the ageing brain in mice. Nat Genet. 2000;25:294–297. - PubMed
    1. Edwards MG, Sarkar D, Klopp R, Morrow JD, Weindruch R, et al. Impairment of the transcriptional responses to oxidative stress in the heart of aged C57BL/6 mice. Ann N Y Acad Sci. 2004;1019:85–95. - PubMed
    1. Verbitsky M, Yonan AL, Malleret G, Kandel ER, Gilliam TC, et al. Altered hippocampal transcript profile accompanies an age-related spatial memory deficit in mice. Learn Mem. 2004;11:253–260. - PMC - PubMed
    1. Dhahbi JM, Tsuchiya T, Kim HJ, Mote PL, Spindler SR. Gene expression and physiologic responses of the heart to the initiation and withdrawal of caloric restriction. J Gerontol A Biol Sci Med Sci. 2006;61:218–231. - PubMed

Publication types