. 2007 Dec;27(6):927-40.
doi: 10.1016/j.immuni.2007.11.011.

TIM-1 and TIM-4 glycoproteins bind phosphatidylserine and mediate uptake of apoptotic cells

Affiliations

TIM-1 and TIM-4 glycoproteins bind phosphatidylserine and mediate uptake of apoptotic cells

Norimoto Kobayashi et al. Immunity. 2007 Dec.

Abstract

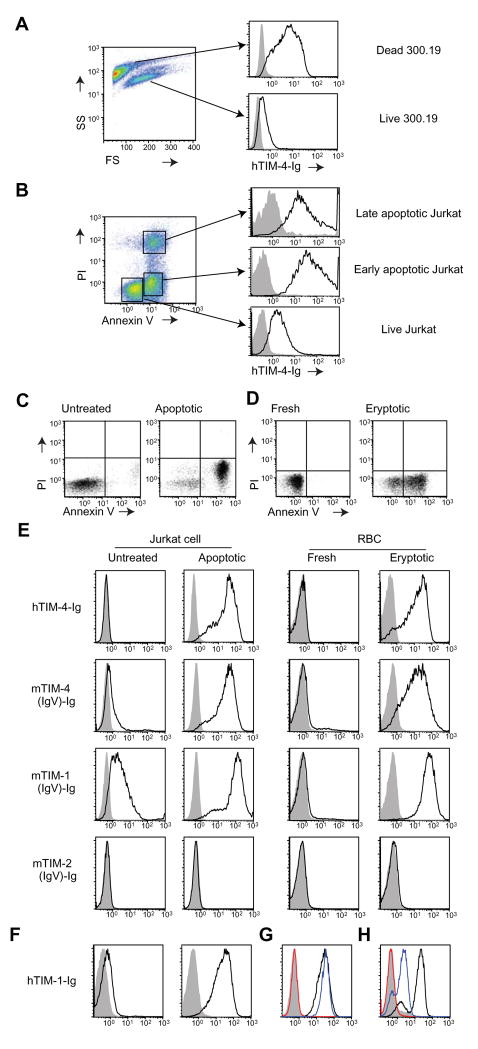
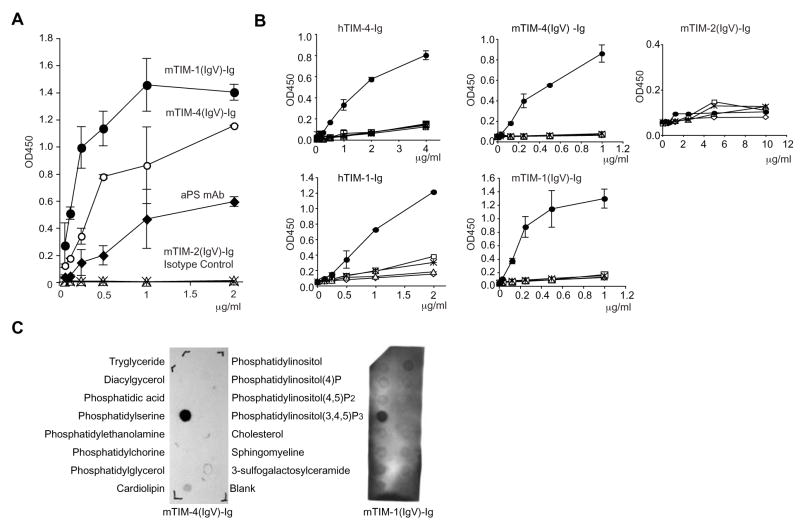
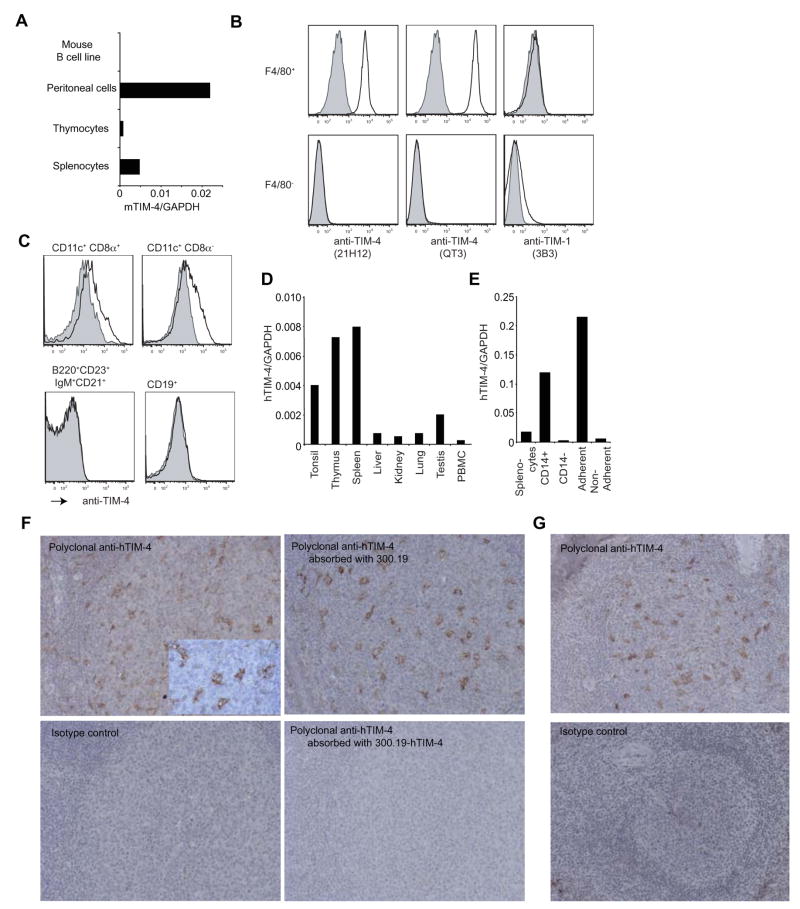
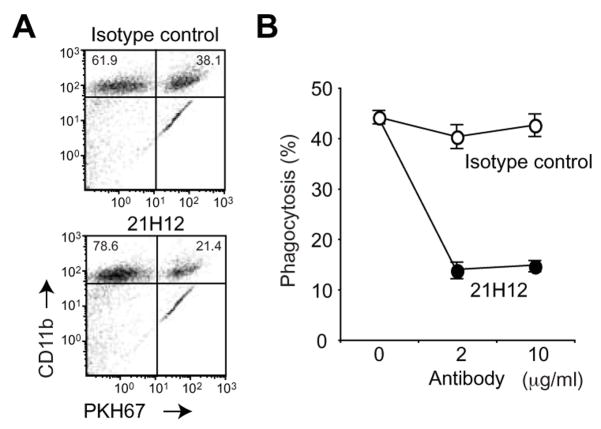
The T cell immunoglobulin mucin (TIM) proteins regulate T cell activation and tolerance. Here we showed that TIM-4 is expressed on human and mouse macrophages and dendritic cells, and both TIM-4 and TIM-1 specifically bound phosphatidylserine (PS) on the surface of apoptotic cells but not any other phospholipid tested. TIM-4(+) peritoneal macrophages, TIM-1(+) kidney cells, and TIM-4- or TIM-1-transfected cells efficiently phagocytosed apoptotic cells, and phagocytosis could be blocked by TIM-4 or TIM-1 monoclonal antibodies. Mutations in the unique cavity of TIM-4 eliminated PS binding and phagocytosis. TIM-4 mAbs that blocked PS binding and phagocytosis mapped to epitopes in this binding cavity. These results show that TIM-4 and TIM-1 are immunologically restricted members of the group of receptors whose recognition of PS is critical for the efficient clearance of apoptotic cells and prevention of autoimmunity.


Figures

Figure 1
Figure 1. TIM-4 and TIM-1, but not TIM-2 fusion proteins bind to apoptotic cells
(A) An overgrown culture of 300.19 cells was stained with hTIM-4-Ig (open curves) or control mIgG2a (filled gray curves). Cells gated on live or dead cells by forward and side scatter were analyzed by flow cytometry. (B) Jurkat cells treated with anti-Fas mAb (1 to 2000 dilution) were stained with hTIM-4-Ig (open curves) or control mIgG2a (filled gray curves) followed by allophycocyanin-conjugated goat anti-mouse IgG2a and annexin-V FITC and PI. Cells gated on live, early, and late apoptotic cells as indicated were analyzed by flow cytometry. (C) Jurkat cells untreated (left panel) or made apoptotic with anti-Fas mAb (1 to 500 dilution, right panel) were ficolled to remove late apoptotic cells and stained with annexin-V FITC and PI. (D) RBC fresh untreated (left panel) or made eryptotic by treatment with ionomycin and CaCl2 (right panel) were stained with annexin-V FITC and PI. (E) Untreated or apoptotic Jurkat cells and fresh or eryptotic RBC made as in 1C and 1D were stained with 1.2 μg/ml of hTIM-4-Ig, or 5 μg/ml of mTIM-1(IgV)-Ig, mTIM-2(IgV)-Ig, or mTIM-4(IgV)-Ig, (shaded) or isotype control mouse IgG2a (filled gray curves). All Ig FP were detected with PE conjugated anti-mouse IgG2a. Data are representative of three or more experiments. (F) Live or apoptotic Jurkat cells were stained with hTIM-1-Ig. Ig FP was detected with PE-conjugated anti-human IgG. (G) Human TIM-4-Ig was pre-incubated with 10 μg/ml of anti-TIM-4 mAbs 9F4 (red line), 4E11 (blue line), or isotype control mouse IgG1 (black line) before staining apoptotic Jurkat cells. Filled gray indicates the staining with isotype control mouse IgG2a. Data are representative of three experiments. (H) Human TIM-1-Ig was pre-incubated with 10 μg/ml of anti-TIM-1 mAbs 3D1 (red line), 1D12 (blue line), or isotype control (black line) before staining apoptotic Jurkat cells. Filled gray indicates staining with control hIgG FP.
Figure 2
Figure 2. TIM-1 and TIM-4, but not TIM-2 bind to phosphatidylserine and not other phospholipids
(A) ELISA plates coated with PS were incubated with the indicated amounts of mTIM-4(IgV)-Ig (○), mTIM-1(IgV)-Ig (●), mTIM-2 (IgV)-Ig (△), anti-PS mAb (◆) or isotype control mouse IgG2a (*). Fusion proteins not bound to the plates were removed by washing, and bound protein quantified by ELISA. Assays were done in duplicate wells, and average values are plotted with S.D. (B) ELISA plates coated with PS (●), PE (□), PC (◇), PI (△) or without phospholipid (*) were incubated with the indicated concentrations of hTIM-4-Ig, hTIM-1-Ig, mTIM-4(IgV)-Ig, mTIM-1(IgV)-Ig or mTIM-2(IgV)-Ig. TIM-Ig bound to wells was quantified by ELISA. All assays were done in duplicate and average values are plotted with S.D. (C) mTIM-4 and mTIM-1 bind strongly to phosphatidylserine on PIP strips. 2 μg/ml of mTIM-4(IgV)-Ig (left) or mTIM-1(IgV)-Ig (right) were incubated with strips spotted with the indicated phospholipids, washed, and developed with anti-mouse IgG2a-HRP.
Figure 3
Figure 3. hTIM-1 or hTIM-4 transfected NIH-3T3 cells phagocytose apoptotic U937 cells or eryptotic RBC but not live cells. Liposomes containing PS blocked phagocytosis
(A–D) CMTMR-labeled live or apoptotic U937 or PKH67 labeled live or eryptotic RBC were co-cultured with 3T3, hTIM-1 3T3 or hTIM-4 3T3 for 45 or 90 min., non-adherent cells washed off, and adherent cells detached and analyzed by flow cytometry or electron microscopy for phagocytosis of labeled cells. (A) FACS profiles for phagocytosis of live or apoptotic U937 by 3T3 (black line), hTIM-1 3T3 (blue line) or hTIM-4 3T3 (red line) after 90 min co-incubation. Phagocytosis assays with (B) U937 cells or (E) RBC were done in duplicate, and average values are plotted with S.D. (C) Electron micrograph of apoptotic U937 phagocytosed by hTIM-4 3T3. Original magnification 5000X. (D) Photomicrograph of CypHer5E-labeled apoptotic U937 compartmentalized to an acidic compartment of hTIM-4 3T3. (F) 3T3 cells or (G–I) hTIM-1 3T3 were labeled with CMFDA (green). U937 were labeled with CMTMR (red) and made apoptotic by 5 hr treatment with etoposide. 3T3 cells and apoptotic U937 cells were co-cultured for 2 hours, washed, and visualized by confocal microscopy as described in experimental procedures. An enlarged image of the boxed region in G is shown in H and a side image in I. (J) Binding of eryptotic RBC to hTIM-1 3T3 or hTIM-4 3T3 was inhibited by liposomes containing a 50:50 mix of PS and PC but not by PC alone. hTIM-1 or TIM-4 3T3 were pre-incubated with liposomes for 15 min. and co-cultured with PKH67 labeled eryptotic RBC for 45 min. After washing out non-attached cells, 3T3 cells were detached and analyzed by flow cytometry for phagocytosis of eryptotic RBC. Assays were done in duplicate and values of 100% represent phagocytosis of eryptotic RBC in the absence of liposomes. (K) Phagocytosis of eryptotic RBC by hTIM-1 or hTIM-4 3T3 was inhibited by liposomes containing PS but not PC, PE or PI. 1 or 10 μM of PS, PC, PE or PI liposomes were pre-incubated with hTIM-1 or TIM-4 3T3 cells. Assays were done in duplicate as described in H.
Figure 4
Figure 4
TIM-4 is expressed in macrophages and dendritic cells. (A) qRT-PCR analysis of TIM-4 mRNA expression in the indicated mouse tissues and a mouse pre-B cell line (300.19). Data are representative of two experiments. (B) Cell surface expression of mTIM-4. Mouse resident peritoneal cells were stained with F4/80-APC and anti-mTIM-4-PE mAb (21H12 or QT3) or anti-TIM-1-PE, and analyzed by flow cytometry gated on F4/80+ or F4/80 cells. (C) Mouse splenic cells were stained with the indicated lineage-specific markers and anti-mTIM-4-PE mAb. Filled gray curves represent isotype control staining and open curves represent staining of lineage-gated cells with anti-mTIM-4 mAb. Results are representative of three experiments. (D) qRT-PCR analysis of TIM-4 mRNA expression in the indicated human tissues. Data are representative of three experiments. (E) qRT-PCR analysis of TIM-4 mRNA expression in human splenic macrophages. Splenic macrophages were enriched with CD14 MACS beads or by adhesion as described in experimental procedures. (F–G) Immunohistochemistry showing TIM-4 expression in (F) human tonsil and (G) spleen. Sections of paraffin-embedded tissue were stained with polyclonal anti-hTIM-4 antibody. Isotype control was normal goat IgG. All micrographs were obtained using the 20x objective, except for inserted frame in F upper left panel (40x).
Figure 5
Figure 5. Anti-TIM-4 mAb blocks phagocytosis of apoptotic cells by mouse peritoneal macrophages
(A) Mouse PMφ were pre-incubated with 10 μg/ml isotype control or 21H12 anti-mTIM4 mAb for 5 min followed by PKH67 labeled apoptotic thymocytes for 30 min. Non-adherent cells were removed by washing, and PMφ were detached and stained with anti-CD11b-PE. The percentage of PKH67 positive CD11b+ cells was analyzed by flow cytometry. (B) Phagocytosis assays were performed as in (A) with the indicated concentrations of 21H12 or isotype control. Assays were done in duplicate and average values are plotted with S.D.
Figure 6
Figure 6. Human kidney cell line 769P expresses hTIM-1 and phagocytoses apoptotic U937 cells and eryptotic RBC through hTIM-1
(A) 769P cells were stained with PE-conjugated anti-hTIM-1 mAb (3D1) or anti-hTIM-4 mAb (9F4) and analyzed by flow cytometry. (B) CMFDA-labeled 769P cells (green) and CMTMR-labeled apoptotic U937 cells (red) were co-cultured for 2 hours, non-adherent cells washed off, and remaining cells fixed and visualized by confocal microscopy. (C) PKH67 labeled fresh and eryptotic RBC were co-cultured with 769P cells for 45 min or 90 min, non-adherent cells washed off, and remaining cells detached and analyzed for PKH67 positive RBC in 769Pcells by flow cytometry. The FACS profiles for PKH67 positive RBC in 769P cells (open curves) and 769P cells without RBC (filled gray curves) are shown in the upper panel and presented graphically in the lower panel. Assays were done in duplicate and average values are plotted with S.D. (D) Phagocytosis of eryptotic RBC was blocked by anti-hTIM-1 mAb. 769P cells were pre-incubated with 3D1, 1D12, or isotype control for 30 min., co-cultured with PKH67 labeled eryptotic RBC for 90 min, non-adherent cells washed off, and remaining cells detached and analyzed for PKH67 positive RBC in 769P by flow cytometry. FACS profiles for PKH67 positive RBC in 769P incubated with 2 μg/ml 3D1 (red line), 1D12 (blue line) or isotype control (black line) are shown in the upper panel and presented graphically in the lower panel. Assays were done in duplicate and average values are plotted with S.D.
Fig 7
Fig 7. Mutants in the hTIM-4 CC′FG cavity do not phagocytose apoptotic cells
(A) Binding of anti-hTIM-4 antibodies to mutant hTIM-4 transfected 3T3 cell lines. WT hTIM-4 and mutant hTIM-4 (W119A, F120A, N121A and D122A) were transfected into NIH-3T3 cells. WT or mutant hTIM-4 3T3 were stained with 9F4, 4E11 or polyclonal anti-hTIM-4 antibody and analyzed by flow cytometry. Open curves represent staining with anti-hTIM-4 antibody, and the filled gray curves represent staining with control mouse IgG1 for 9F4 and 4E11, or goat IgG for polyclonal anti-hTIM-4 antibody. Numbers in the panels are mean fluorescence intensity of the TIM-4 stained cells. (B) 9F4 but not 4E11 blocked phagocytosis of eryptotic RBC by hTIM-4 3T3. hTIM-4 3T3 were pre-incubated with 9F4, 4E11 or isotype control mouse IgG1 for 30 min, co-cultured with PKH67-labeled eryptotic RBC, non-adherent cells washed off, and remaining cells detached and analyzed for PKH67 positive RBC in hTIM-4 3T3 by flow cytometry. Assays were done in duplicate and average values are plotted with S.D. (C, D) Phagocytosis of PKH67-labeled eryptotic RBC by mutant TIM-4 3T3. The indicated TIM-4 3T3 transfectants were co-cultured with PKH67-labeled eryptotic RBC, non-adherent cells washed off, and remaining cells detached and analyzed for PKH67 positive RBC in hTIM-4 3T3 by flow cytometry. FACS profiles of 90 min culture are shown in C. Filled gray curves represent untransfected 3T3 with eryptotic RBC, and open curves represent the indicated TIM-4 transfectant with eryptotic RBC. Results at 45 and 90 minutes are presented graphically in D. Assays were done in duplicate and average values are plotted with S.D.

Comment in

Similar articles

Cited by

References

    1. Asano K, Miwa M, Miwa K, Hanayama R, Nagase H, Nagata S, Tanaka M. Masking of phosphatidylserine inhibits apoptotic cell engulfment and induces autoantibody production in mice. J Exp Med. 2004;200:459–467. - PMC - PubMed
    1. Balasubramanian K, Chandra J, Schroit AJ. Immune clearance of phosphatidylserine-expressing cells by phagocytes. The role of beta2-glycoprotein I in macrophage recognition. J Biol Chem. 1997;272:31113–31117. - PubMed
    1. Beletskii A, Cooper M, Sriraman P, Chiriac C, Zhao L, Abbot S, Yu L. High-throughput phagocytosis assay utilizing a pH-sensitive fluorescent dye. Biotechniques. 2005;39:894–897. - PubMed
    1. Binne LL, Scott ML, Rennert PD. Human TIM-1 associates with the TCR complex and up-regulates T cell activation signals. J Immunol. 2007;178:4342–4350. - PubMed
    1. Borisenko GG, Matsura T, Liu SX, Tyurin VA, Jianfei J, Serinkan FB, Kagan VE. Macrophage recognition of externalized phosphatidylserine and phagocytosis of apoptotic Jurkat cells--existence of a threshold. Arch Biochem Biophys. 2003;413:41–52. - PubMed

Publication types

MeSH terms