. 2008 Apr 30;169(2):405-16.
doi: 10.1016/j.jneumeth.2007.10.021. Epub 2007 Nov 7.

Homeostasis of neuronal avalanches during postnatal cortex development in vitro

Affiliations

Homeostasis of neuronal avalanches during postnatal cortex development in vitro

Craig V Stewart et al. J Neurosci Methods. .

Abstract

Cortical networks in vivo and in vitro are spontaneously active in the absence of inputs, generating highly variable bursts of neuronal activity separated by up to seconds of quiescence. Previous measurements in adult rat cortex revealed an intriguing underlying organization of these dynamics, termed neuronal avalanches, which is indicative of a critical network state. Here we demonstrate that neuronal avalanches persist throughout development in cortical slice cultures from newborn rats. More specifically, we find that in spite of large variations of average rate in activity, spontaneous bursts occur with power-law distributed sizes (exponent -1.5) and a critical branching parameter close to 1. Our findings suggest that cortical networks homeostatically regulate a critical state during postnatal maturation.


Figures

Figure 1
Figure 1
Anatomical reconstruction and basic features of spontaneous activity in organotypic cortex slice cultures grown on MEAs. A, Light microscopic image of a living culture grown on an MEA taken at 1 DIV. B, Two-dimensional plot of synchronized, spontaneous population activity over a period of 1 s. Each subplot displays the LFP time course at the corresponding electrode location. Three population events, each at a different developmental age, were over plotted for comparison. C, Reconstruction of MEA position and neuronal activity for 6 representative cultures. Each reconstruction shows the average summed LFP activity per hour (left) and corresponding distribution of avalanche initiation sites (Pinit; right) for three different developmental stages (8, 14, and 28 DIV). Neuronal activity is concentrated towards the upper half in most cultures. Note that Pinit sites are highly localized in some cultures early during development, but distributed widely throughout the culture during later developmental stages (e.g. a6042, j5811). Average activity levels at each electrode were normalized to the maximal local activity found in each network during development (see 100% nLFP circle diameter). In contrast, Pinit values in the networks were normalized for each developmental period (compare to 100% Pinit diameter). Values from different developmental ages were over plotted in decreasing order for better visualization. Only LFPrel and Pinit values > 5% are shown. Array location (8×8 dot matrix) and anatomical boundaries of cortex cultures were taken from pictures at 1 – 2 DIV. Broken, dotted lines: dorsal and ventral borders of the culture respectively after 21 – 28 DIV.
Figure 2
Figure 2
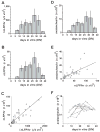
The developmental time course of neuronal activity levels, nLFP rate, and neuronal avalanche rate in organotypic cultures during postnatal maturation. A, Activity levels are detectable earliest between 5 – 10 DIV, reach a peak during 25 – 30 DIV, after which they decline (n = 9 cultures). Average integrated nLFP amplitudes on the array per hr from all cultures grouped into successive developmental periods of 5 days. B, Corresponding change in nLFP rate. C, Correlation between activity level and nLFP rate for individual cultures plotted for all development ages. Broken line: linear regression. D, Developmental time course of neuronal avalanche rate. E, Neuronal avalanche rate correlates with nLFP rate (broken line). Scatter plot of avalanche rate and nLFP rate for each network across all developmental ages. F, Developmental time course of neuronal avalanche rate for individual cultures (semi-logarithmic scale). Note that most cultures increase in avalanche activity by about one order of magnitude during the first week of cultivation. During periods of maximal activity, about 12,000 neuronal avalanches with sizes > 5 μV arise spontaneously per hr in a culture.
Figure 3
Figure 3
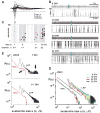
The size distribution of neuronal avalanches obeys a power law during development. A, Overplot of spontaneous LFP activity on all electrodes during one synchronous event. For each electrode, the time point and amplitude of negative LFP peaks (nLFP) below threshold (broken line) are extracted. Thresholds are calculated individually for each electrode at -3SD of the electrode noise. B, Organization of spontaneous nLFPs from one culture at 4 different developmental ages. 5 hrs (top) and 10 min of activity at higher temporal resolution (bottom; blue rectangle) are shown for each age. Synchronous population events, i.e. nLFP clusters, appear as ‘columns’ in the raster display at higher temporal resolution. The nLFP rate increases during postnatal maturation, while the basic pattern of synchronized population events separated by periods of quiescence is maintained. C, The nLFPs (filled circles) form spatiotemporal patterns when displayed in a raster plot. For a particular bin width Δt, the nLFPs are grouped into clusters, i.e. neuronal avalanches (gray areas), by grouping all time bins that contain at least one nLFP until a time bin with no nLFP is encountered. The size s of neuronal avalanches is shown in the number of active electrodes n. Similarly, the branching parameter σ is calculated from the beginning of an avalanche by dividing the number of descendants (red nLFPs) by the number of ancestors (blue nLFPs). For a critical branching process, on average the number of descendants equals the number of ancestors, i.e. σ = 1. D, Distribution of avalanche sizes for the raster plots shown in B. Note that throughout development, all distributions form a power law with a slope α close to −1.5 (broken line), whether expressed as number of active electrodes (elec.) or summed nLFP amplitudes (LFP). E, Example of a culture that showed a bimodal distribution in nLFP clusters early during development, that is, clusters were either small or large (arrow) encompassing most of the active network area (top). This distribution changed into a power law during the 2nd week (bottom).
Figure 4
Figure 4
The power law exponent in avalanche size distributions has an upper limit of α = −1.5. A, Developmental time course of the exponent α during postnatal maturation. The exponent α does not extend beyond −1.5 (from size distributions based on number of electrodes). Note that some cultures demonstrated α = −1.5 during early development and maintained this value for several weeks, whereas other cultures reached α = −1.5 during the second week of maturation where they remained. Only one culture maintained a slope value more negative than α = −1.5 throughout development (open circle). B, The preferred value of α = −1.5 is readily visible in the bimodal distribution of slope values taken from all cultures and developmental ages. C, A strong correlation exists between the estimate of the exponent α from avalanche size distributions based on total number of electrodes (αele) or summed nLFP (αLFP). Scatter plot of both estimates for each network and developmental state. D, A slope value of α = −1.5 is established at activity levels that differ by more than two orders of magnitude. Scatter plot of α as a function of absolute summed nLFP amplitudes per hr (note semi-logarithmic coordinates). E, Cultures that reach α = −1.5 show a tendency for a shorter Δtavg, i.e. increased propagation velocity of nLFPs. F, The preference of α = −1.5 during maturation is independent from Δtavg, which does not depend on developmental age.
Figure 5
Figure 5
As the exponent α reaches α = −1.5, the branching parameter σ converges towards σ = 1. Scatter plot between the estimate of the exponent α from the avalanche size distributions and the branching parameter σ for each network and developmental state. For slopes much steeper than α = −1.5, the branching parameter σ is significantly smaller than 1 (open circles).

Similar articles

Cited by

References

    1. Abeles M. Corticonics. 1. Cambridge University Press; New York Port Chester Melbourne Sydney: 1992.
    1. Arieli A. Novel strategies to unravel mechanisms of cortical function: From macro- to micro-electrophysiological recordings. In: Aertsen A, Braitenberg V, editors. Information Processing in the Cortex. Springer-Verlag; Berlin: 1992. pp. 123–37.
    1. Bak P. How Nature Works: The Science of Self-Organized Criticality. Copernicus Books; New York: 1996.
    1. Bak P, Chen K, Paczuski M. Solitons in the one-dimensional forest fire model. Phys Rev Lett. 2001;86:2475–7. - PubMed
    1. Bak P, Paczuski M. Complexity, contingency, and criticality. Proc Natl Acad Sci U S A. 1995;92:6689–96. - PMC - PubMed

Publication types

LinkOut - more resources