

Phosphatase and tensin homolog, deleted on chromosome 10 deficiency in brain causes defects in synaptic structure, transmission and plasticity, and myelination abnormalities
- PMID: 18082964
- PMCID: PMC2278004
- DOI: 10.1016/j.neuroscience.2007.10.048
Phosphatase and tensin homolog, deleted on chromosome 10 deficiency in brain causes defects in synaptic structure, transmission and plasticity, and myelination abnormalities
Abstract
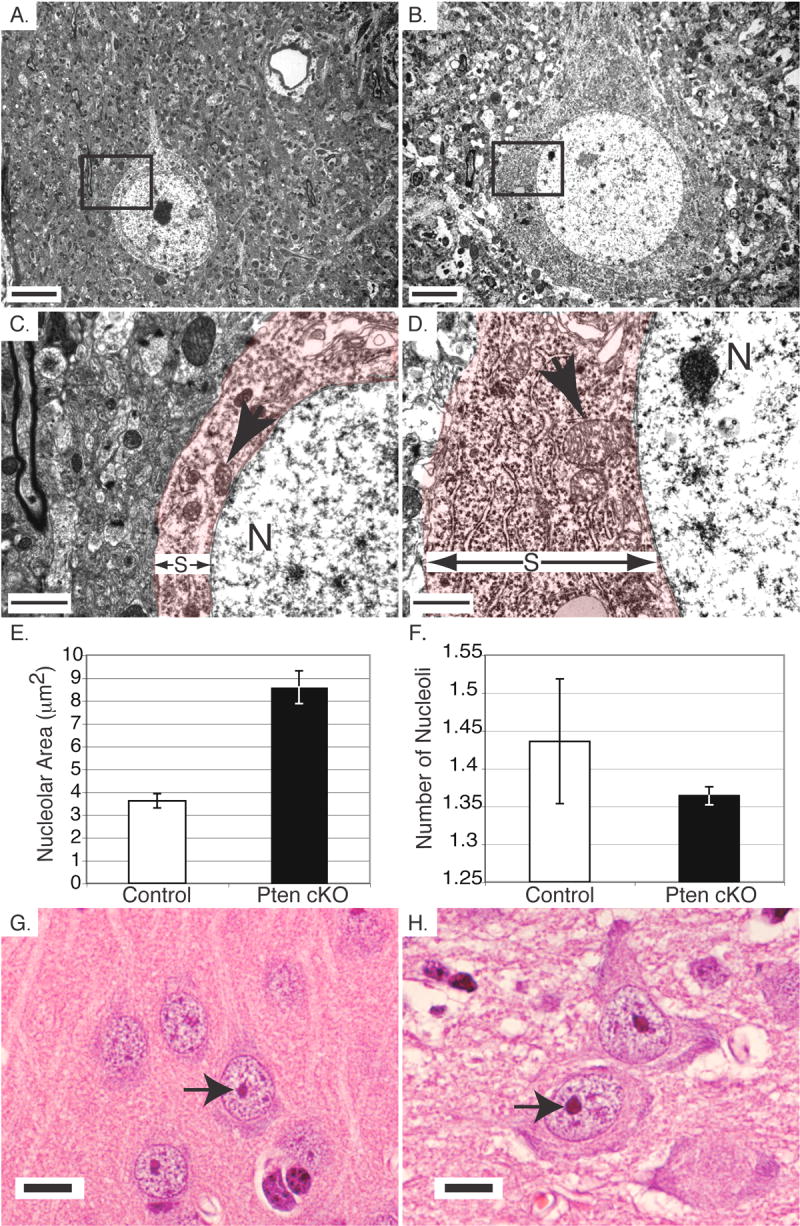
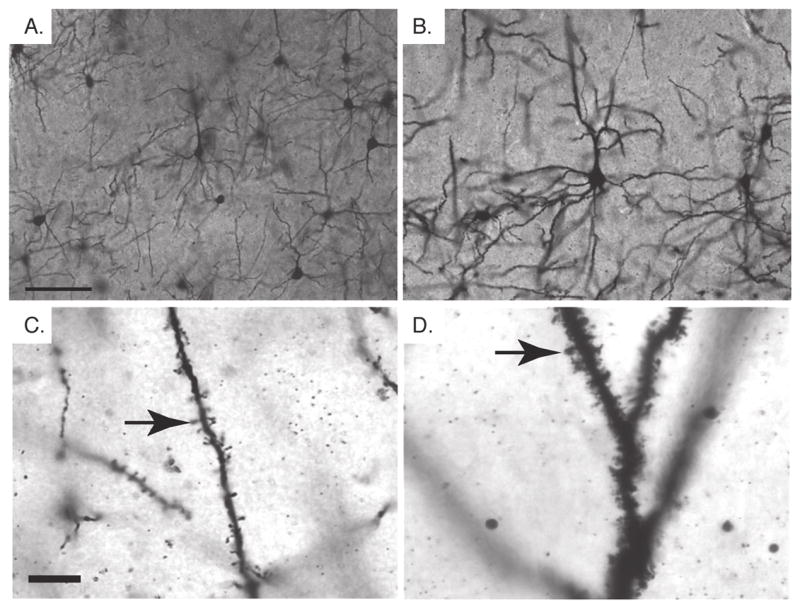
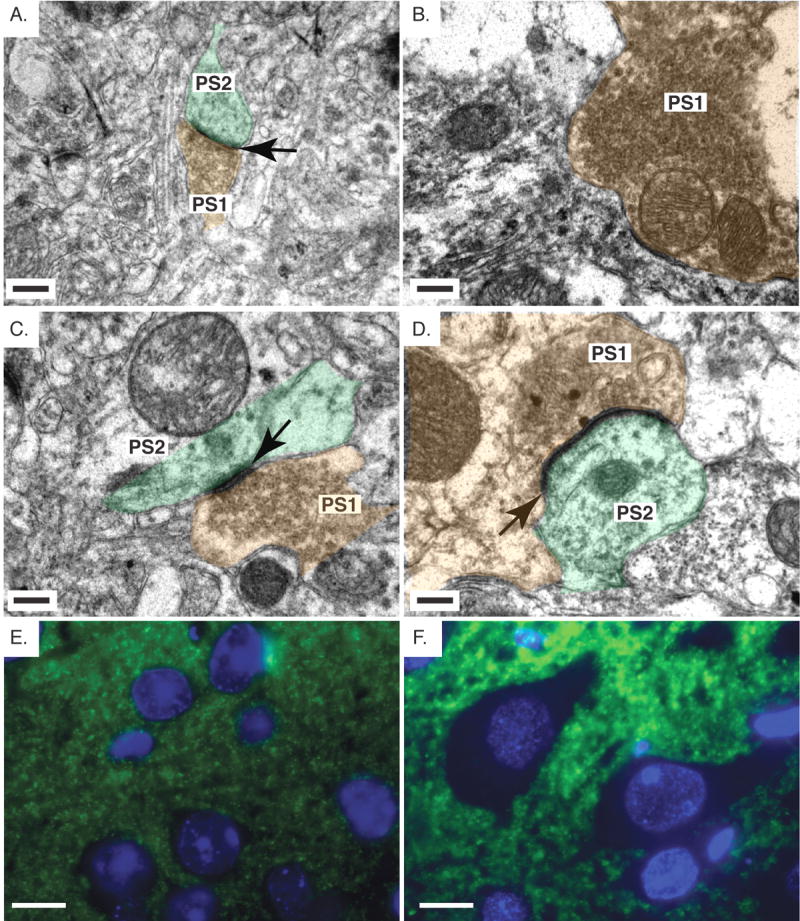
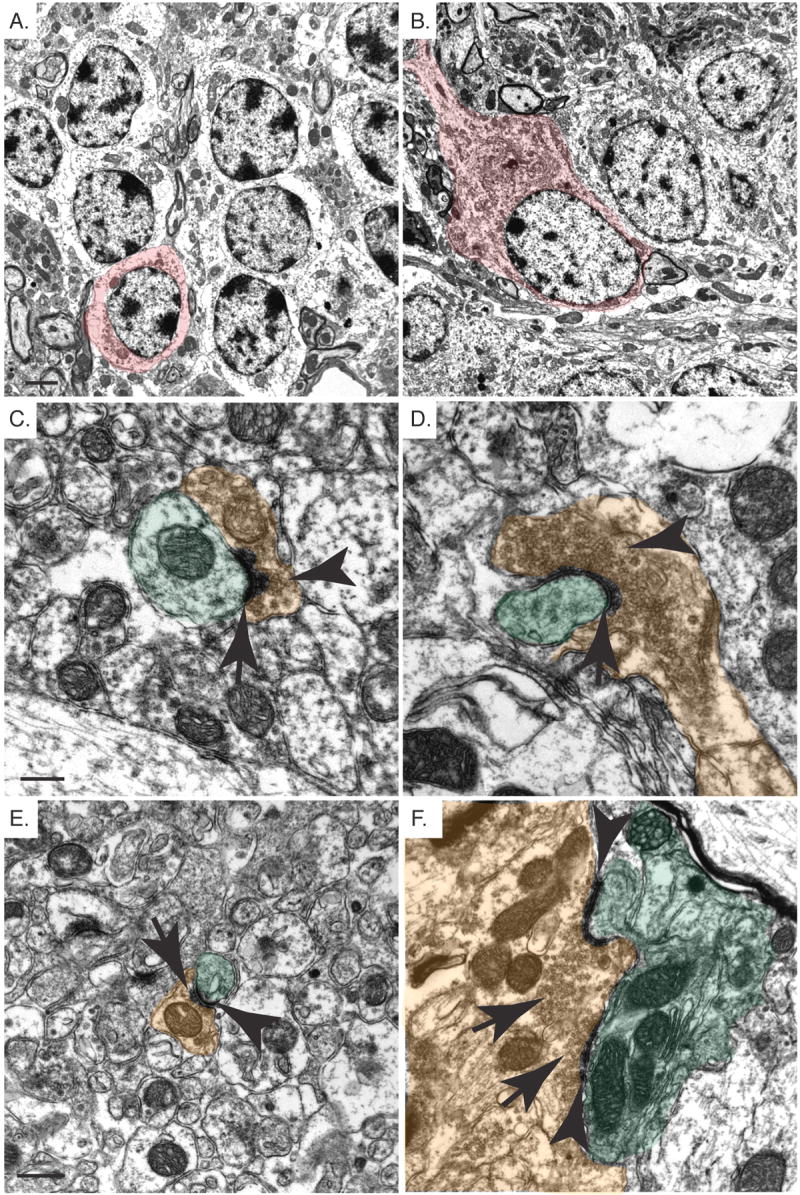
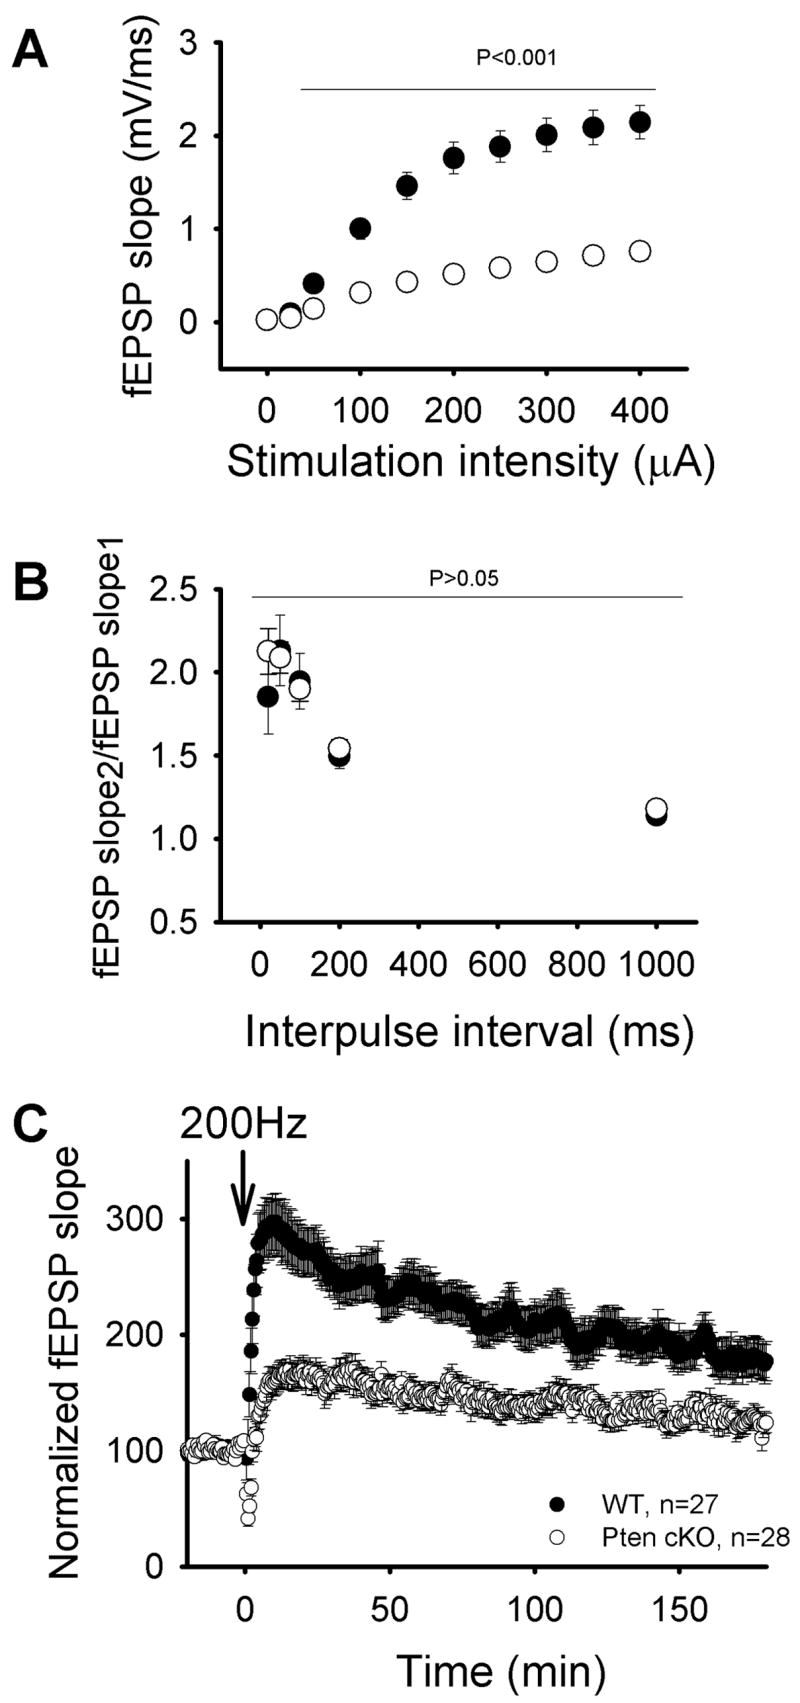
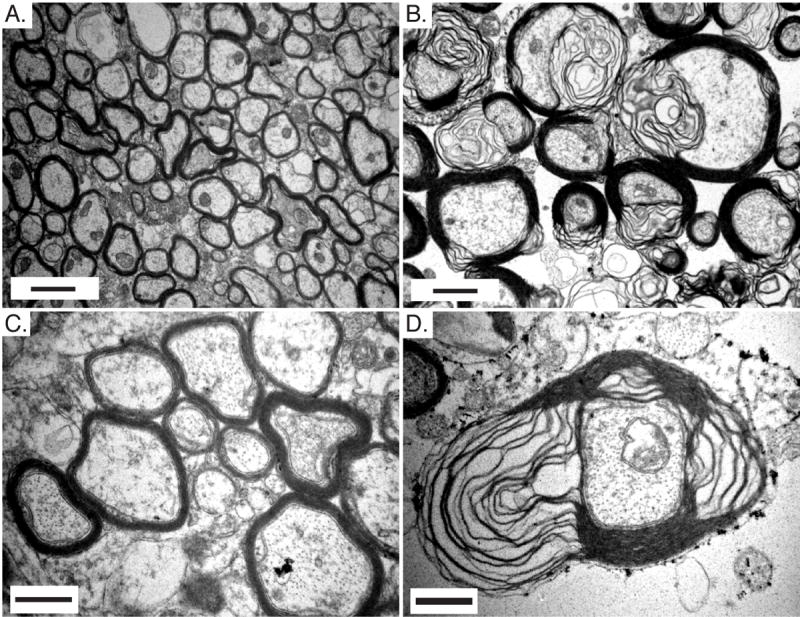
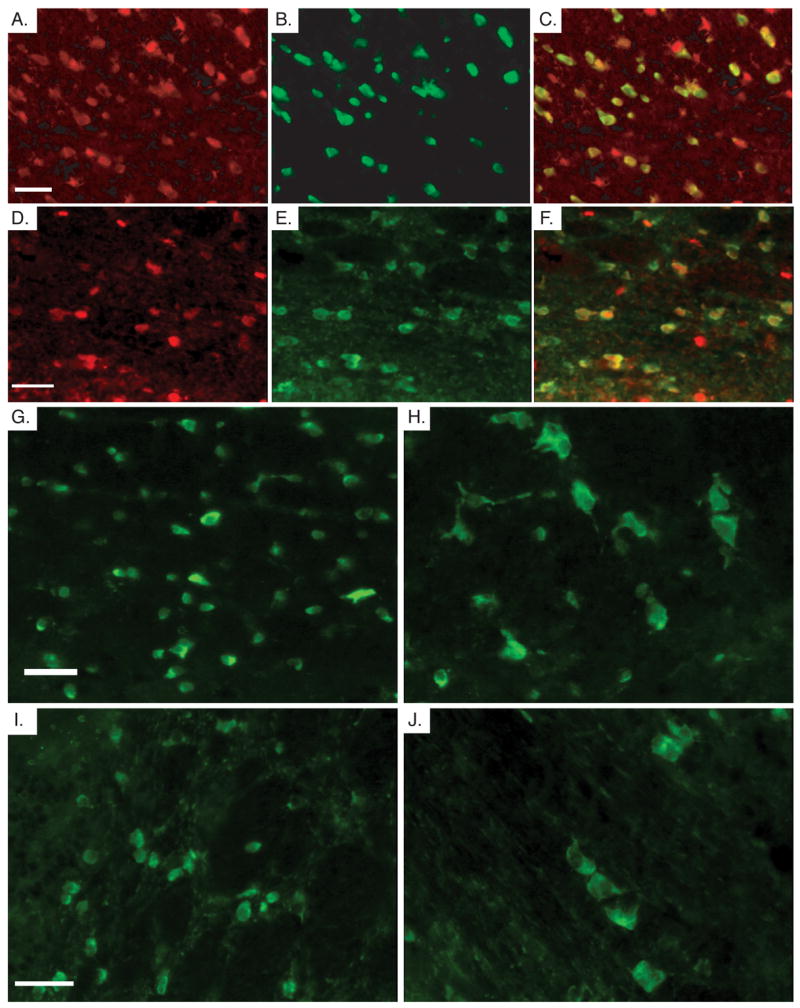
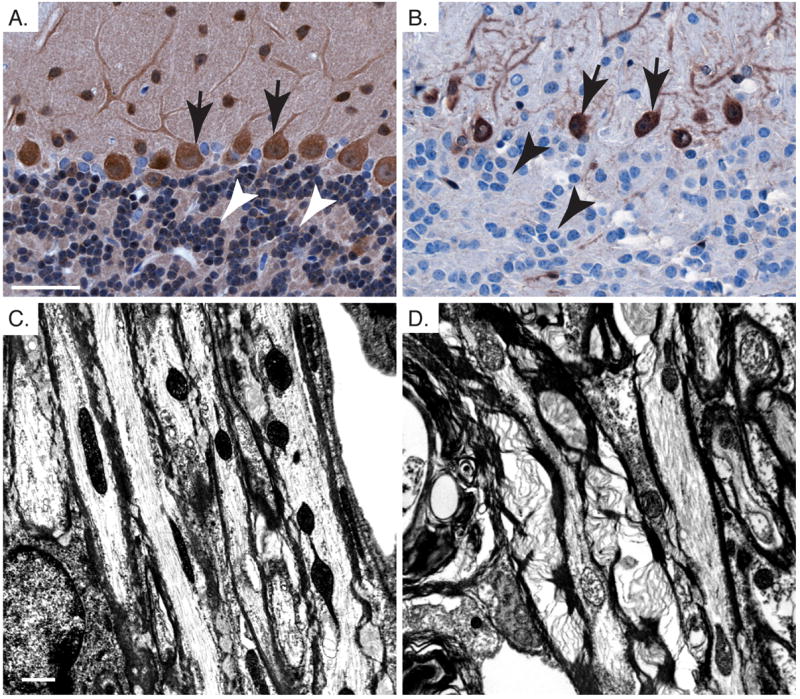
The phosphatidylinositol 3-kinase (PI3K) signaling pathway modulates growth, proliferation and cell survival in diverse tissue types and plays specialized roles in the nervous system including influences on neuronal polarity, dendritic branching and synaptic plasticity. The tumor-suppressor phosphatase with tensin homology (PTEN) is the central negative regulator of the PI3K pathway. Germline PTEN mutations result in cancer predisposition, macrocephaly and benign hamartomas in many tissues, including Lhermitte-Duclos disease, a cerebellar growth disorder. Neurological abnormalities including autism, seizures and ataxia have been observed in association with inherited PTEN mutation with variable penetrance. It remains unclear how loss of PTEN activity contributes to neurological dysfunction. To explore the effects of Pten deficiency on neuronal structure and function, we analyzed several ultra-structural features of Pten-deficient neurons in Pten conditional knockout mice. Using Golgi stain to visualize full neuronal morphology, we observed that increased size of nuclei and somata in Pten-deficient neurons was accompanied by enlarged caliber of neuronal projections and increased dendritic spine density. Electron microscopic evaluation revealed enlarged abnormal synaptic structures in the cerebral cortex and cerebellum. Severe myelination defects included thickening and unraveling of the myelin sheath surrounding hypertrophic axons in the corpus callosum. Defects in myelination of axons of normal caliber were observed in the cerebellum, suggesting intrinsic abnormalities in Pten-deficient oligodendrocytes. We did not observe these abnormalities in wild-type or conditional Pten heterozygous mice. Moreover, conditional deletion of Pten drastically weakened synaptic transmission and synaptic plasticity at excitatory synapses between CA3 and CA1 pyramidal neurons in the hippocampus. These data suggest that Pten is involved in mechanisms that control development of neuronal and synaptic structures and subsequently synaptic function.
Figures
Similar articles
-
Phosphatase and tensin homologue (PTEN) regulates synaptic plasticity independently of its effect on neuronal morphology and migration.J Physiol. 2012 Feb 15;590(4):777-92. doi: 10.1113/jphysiol.2011.220236. Epub 2011 Dec 6. J Physiol. 2012. PMID: 22147265 Free PMC article.
-
S6k1 is not required for Pten-deficient neuronal hypertrophy.Brain Res. 2006 Jul 19;1100(1):32-41. doi: 10.1016/j.brainres.2006.05.013. Epub 2006 Jun 13. Brain Res. 2006. PMID: 16777079
-
Dysregulation of synaptic plasticity precedes appearance of morphological defects in a Pten conditional knockout mouse model of autism.Proc Natl Acad Sci U S A. 2013 Mar 19;110(12):4738-43. doi: 10.1073/pnas.1222803110. Epub 2013 Mar 4. Proc Natl Acad Sci U S A. 2013. PMID: 23487788 Free PMC article.
-
The integral role of PTEN in brain function: from neurogenesis to synaptic plasticity and social behavior.Acta Neurobiol Exp (Wars). 2025 Jan 14;84(4):309-318. doi: 10.55782/ane-2024-2657. Acta Neurobiol Exp (Wars). 2025. PMID: 39812527 Review.
-
PTEN: Local and Global Modulation of Neuronal Function in Health and Disease.Trends Neurosci. 2017 Feb;40(2):83-91. doi: 10.1016/j.tins.2016.11.008. Epub 2017 Jan 10. Trends Neurosci. 2017. PMID: 28081942 Review.
Cited by
-
Axon growth and synaptic function: A balancing act for axonal regeneration and neuronal circuit formation in CNS trauma and disease.Dev Neurobiol. 2020 Jul;80(7-8):277-301. doi: 10.1002/dneu.22780. Epub 2020 Sep 28. Dev Neurobiol. 2020. PMID: 32902152 Free PMC article. Review.
-
Excessive activation of mTOR in postnatally generated granule cells is sufficient to cause epilepsy.Neuron. 2012 Sep 20;75(6):1022-34. doi: 10.1016/j.neuron.2012.08.002. Neuron. 2012. PMID: 22998871 Free PMC article.
-
A PTEN-Autophagy Risk Model for the Prediction of Prognosis and Immune Microenvironment in Hepatocellular Carcinoma.J Oncol. 2023 Feb 20;2023:2973480. doi: 10.1155/2023/2973480. eCollection 2023. J Oncol. 2023. PMID: 36861063 Free PMC article.
-
Mechanisms regulating neuronal excitability and seizure development following mTOR pathway hyperactivation.Front Mol Neurosci. 2014 Mar 14;7:18. doi: 10.3389/fnmol.2014.00018. eCollection 2014. Front Mol Neurosci. 2014. PMID: 24672426 Free PMC article. Review.
-
Transcription factor TFAP2C regulates major programs required for murine fetal germ cell maintenance and haploinsufficiency predisposes to teratomas in male mice.PLoS One. 2013 Aug 13;8(8):e71113. doi: 10.1371/journal.pone.0071113. eCollection 2013. PLoS One. 2013. PMID: 23967156 Free PMC article.
References
-
- Ali IU, Schriml LM, Dean M. Mutational spectra of PTEN/MMAC1 gene: a tumor suppressor with lipid phosphatase activity. J Natl Cancer Inst. 1999;91:1922–1932. - PubMed
-
- Backman SA, Stambolic V, Suzuki A, Haight J, Elia A, Pretorius J, Tsao MS, Shannon P, Bolon B, Ivy GO, Mak TW. Deletion of Pten in mouse brain causes seizures, ataxia and defects in soma size resembling Lhermitte-Duclos disease. Nat Genet. 2001;29:396–403. - PubMed
-
- Butler MG, Dasouki MJ, Zhou XP, Talebizadeh Z, Brown M, Takahashi TN, Miles JH, Wang CH, Stratton R, Pilarski R, Eng C. Subset of individuals with autism spectrum disorders and extreme macrocephaly associated with germline PTEN tumour suppressor gene mutations. J Med Genet. 2005;42:318–321. - PMC - PubMed
Publication types
MeSH terms
Substances
Grants and funding
LinkOut - more resources
Full Text Sources
Molecular Biology Databases
Research Materials
Miscellaneous
