. 2008 Mar-Apr;125(3-4):299-313.
doi: 10.1016/j.mod.2007.11.001. Epub 2007 Nov 17.

Transcription factor broad suppresses precocious development of adult structures during larval-pupal metamorphosis in the red flour beetle, Tribolium castaneum

Affiliations

Transcription factor broad suppresses precocious development of adult structures during larval-pupal metamorphosis in the red flour beetle, Tribolium castaneum

R Parthasarathy et al. Mech Dev. 2008 Mar-Apr.

Abstract

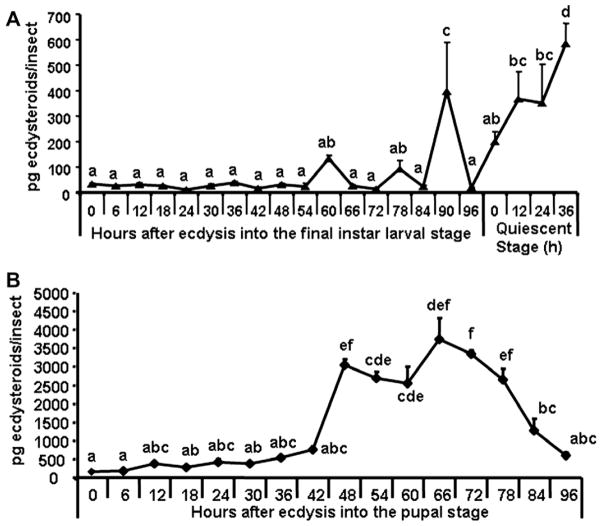
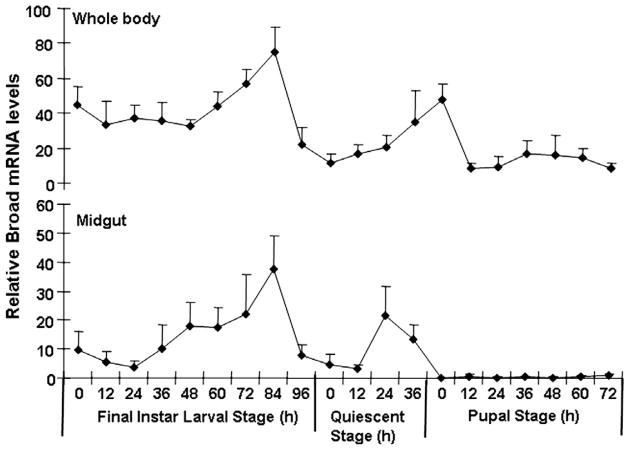
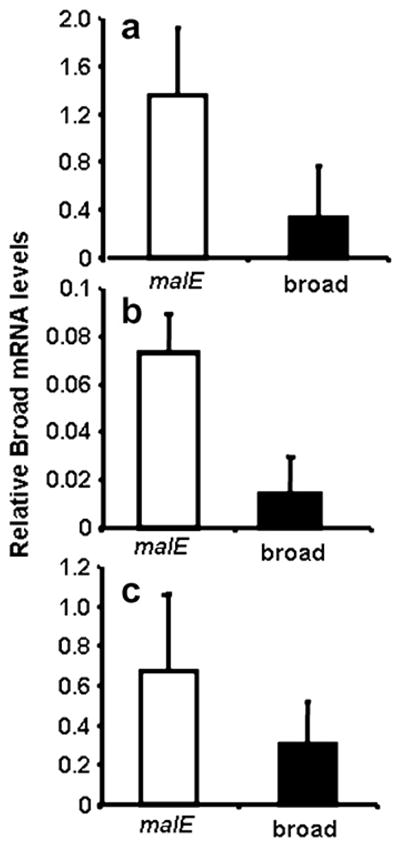
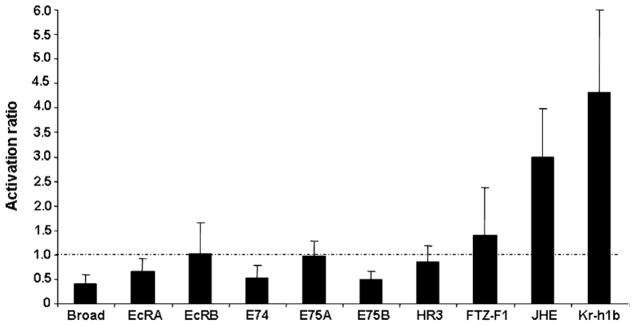
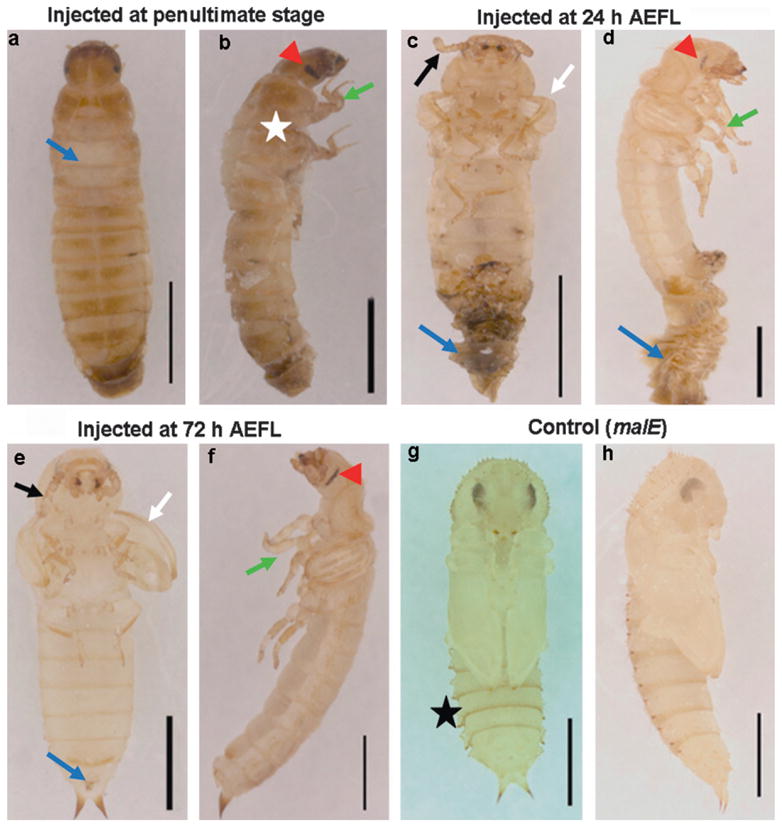
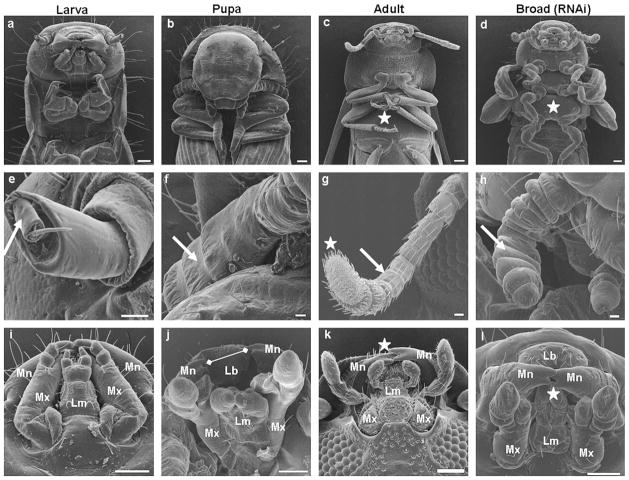
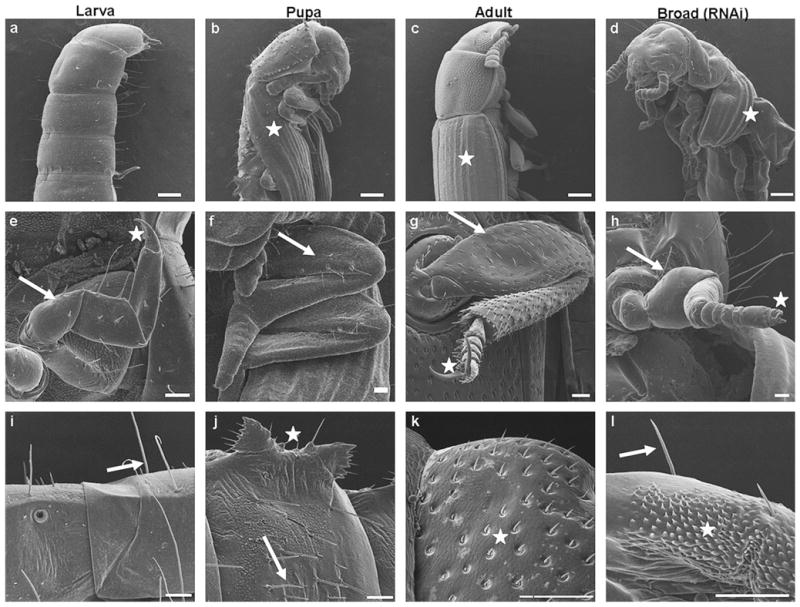
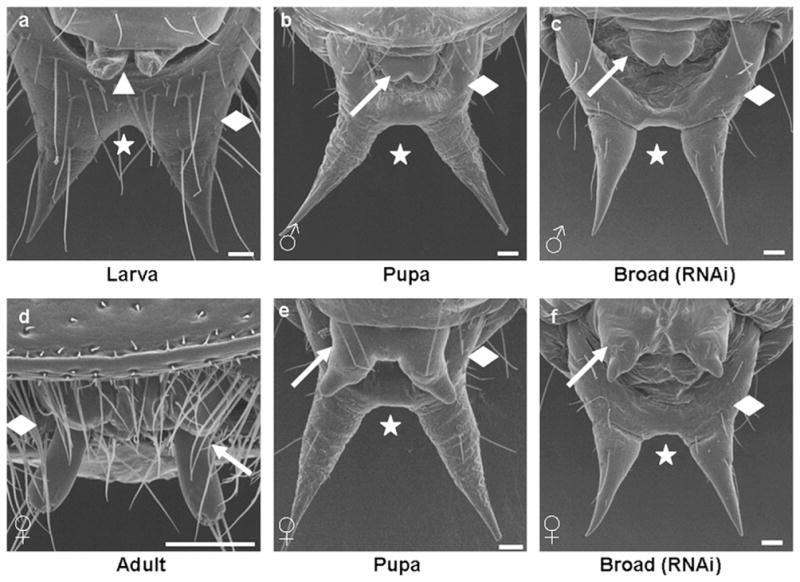
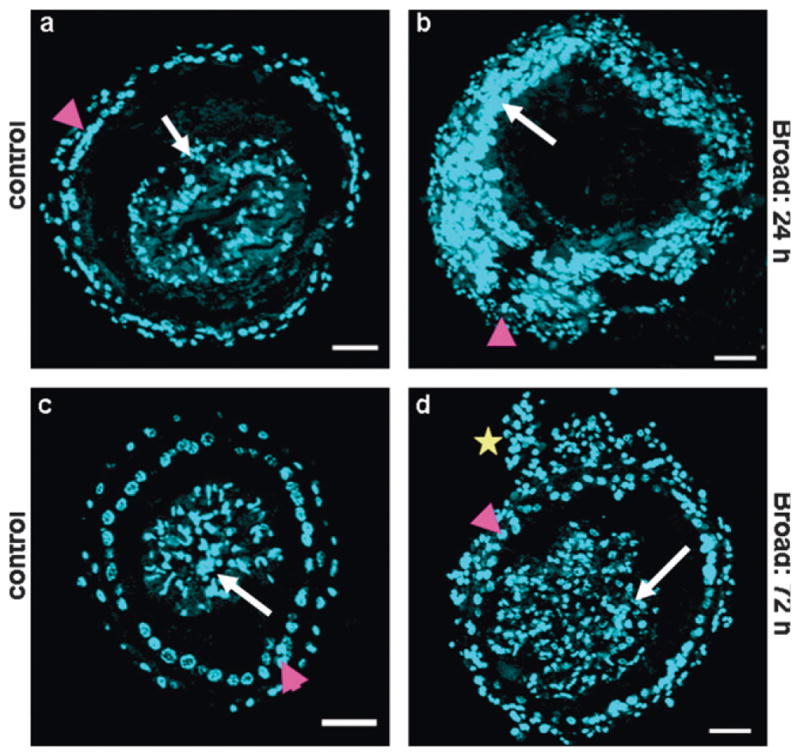
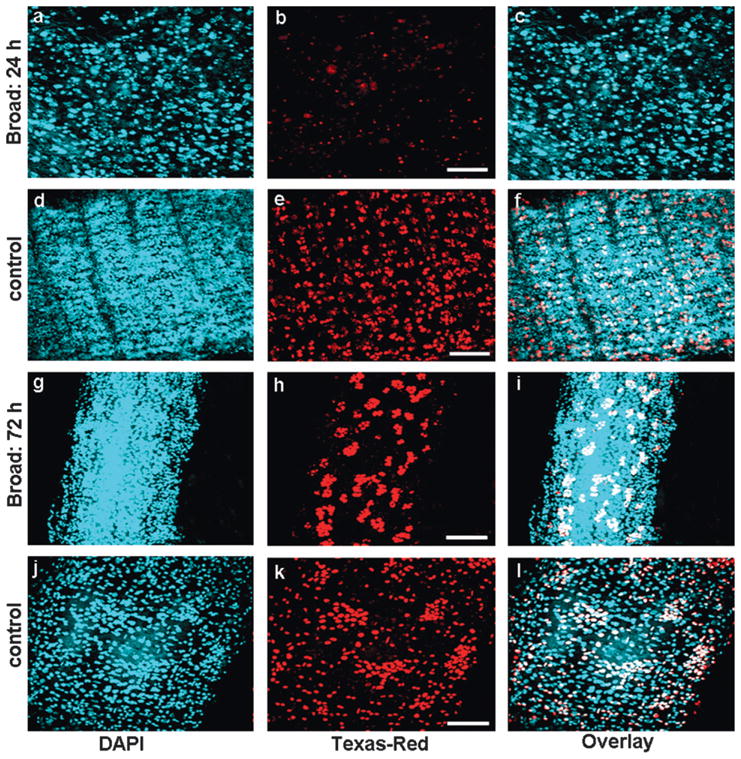
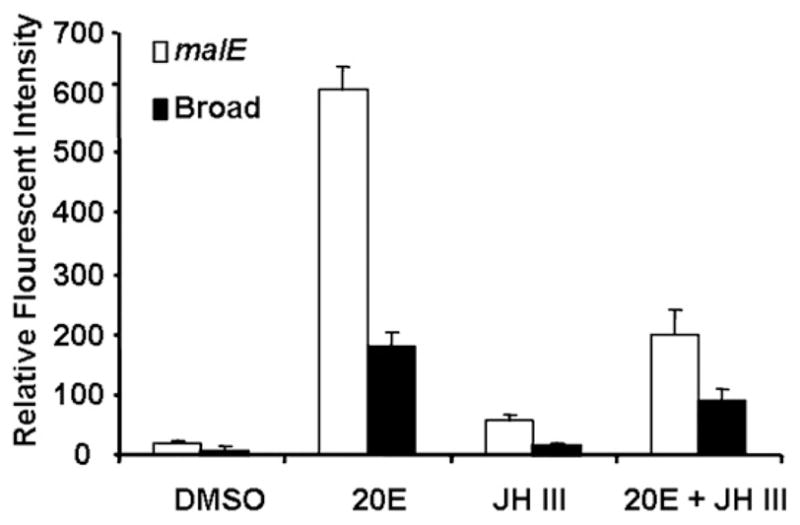
Broad (br), a transcription factor containing the Broad-Tramtrack-Bric-a-brac (BTB) and zinc finger domains was shown to mediate 20-hydroxyecdysone (20E) action and pupal development in Drosophila melanogaster and Manduca sexta. We determined the key roles of br during larval-pupal metamorphosis using RNA interference (RNAi) in a coleopteran insect, Tribolium castaneum. Two major peaks of T. castaneum broad (Tcbr) mRNA, one peak at the end of feeding stage prior to the larvae entering the quiescent stage and another peak during the quiescent stage were detected in the whole body and midgut tissue dissected from staged insects. Expression of br during the final instar larval stage is essential for successful larval-pupal metamorphosis, because, RNAi-mediated knock-down of Tcbr during this stage derailed larval-pupal metamorphosis and produced insects that showed larval, pupal and adult structures. Tcbr dsRNA injected into the final instar larvae caused reduction in the mRNA levels of genes known to be involved in 20E action (EcRA, E74 and E75B). Tcbr dsRNA injected into the final instar larvae also caused an increase in the mRNA levels of JH-response genes (JHE and Kr-h1b). Knock-down of Tcbr expression also affected 20E-mediated remodeling of midgut during larval-pupal metamorphosis. These data suggest that the expression of Tcbr during the final instar larval stage promotes pupal program while suppressing the larval and adult programs ensuring a transitory pupal stage in holometabolous insects.


Figures

Fig. 1
Fig. 1
Estimation of ecdysteroid levels in the final instar larval (A) and pupal (B) stages of T. castaneum. Insects were staged every 6 h during the final instar larval stage (0–96), every 12 h during the quiescent stage (0–36), every 6 h during the pupal stage (0–96). Ecdysteroid levels were estimated using enzyme immunoassay as previously described (Kingan and Adams, 2000; Gelman et al., 2002). Each time point represents mean ± SE of 10 individual insects. Each time point was replicated three times. Means with the same letter are not significantly different (α ≤ 0.05; ANOVA).
Fig. 2
Fig. 2
mRNA levels of Tcbr in the whole body and the midgut of T. castaneum determined by quantitative reverse-transcriptase real-time PCR (qRT-PCR). Samples were collected at 12 h interval during the final instar larval and pupal stages. Total RNA was extracted from pools of three larvae for each treatment. The Y-axis denotes expression levels normalized using the rp49 levels as an internal control. Mean ± SE of two independent experiments with three replications each are shown.
Fig. 3
Fig. 3
mRNA levels of Tcbr in dsRNA injected and control insects. dsRNA injections were done during penultimate larval stage (a), final instar larval stage [24 h (b) and 72 h AEFL (c)]. The insects were sampled at 4–5 days after injection. See text for details. Total RNA was extracted from individual three larvae for each treatment. cDNAs prepared from the RNA were used in qRT-PCR. The relative expression levels of Tcbr mRNA were determined using the levels of rp49 as an internal control. Mean ± SE of three independent experiments are shown.
Fig. 4
Fig. 4
The activation ratio of mRNA levels of 20E- and JH-response genes in insects injected with Tcbr dsRNA. The mRNA levels of 20E-response genes (Broad, EcRA, EcRB, HR3, FTZ-F1, E74, E75A and E75B) and JH-response genes (JHE and Kr-h1b) were determined in insects injected with Tcbr dsRNA using qRT-PCR. Tcbr dsRNA injected at 24 h AEFL and total RNA was extracted from pools of three larvae for each treatment at 4 days after injection. cDNAs prepared from the RNA were used for qRT-PCR analysis. The mRNA levels were normalized using the levels of rp49 as an internal control. The expression levels of each gene in the corresponding control insects injected with malE dsRNA was set as 1 (dashed line). Mean ± SE for three independent experiments are shown.
Fig. 5
Fig. 5
Phenotypes of knock-down of Tcbr. Tcbr or malE dsRNA (control) was injected into penultimate larval stage (a and b) or at 24 h (c and d) or at 72 h (e and f) after ecdysis into the final instar larval stage and the corresponding phenotypes are shown in comparison with control (g and h)). (a) The dorsal view, (c, e and g) the ventral view and (b, d, f and h) the lateral view of Tcbr RNAi and malE RNAi (control) insects. Injections were given within 24 h of penultimate larval stage and 24 and 72 h of last instar larval stage. (a) Split in the dorsal thoracic region (blue arrow). (b) Wing pads (white star), compound eyes (red arrow-head) and differentiated legs (green arrow). (c and d) The exuviae remained attached to the body (blue arrow) when injections are done at 24 h AEFL. Irrespective of time of injection, note the development of antennae (c and e, black arrows), wings (c and e, white arrows), legs (d and f, green arrow) and compound eyes (d and f, red arrowhead) at different differentiating states. Note the absence of gin-traps in Tcbr dsRNA injected insects (c and e) but present in the control pupal abdomen (g, black star). Scale bar: 1 mm.
Fig. 6
Fig. 6
Knock-down in Tcbr expression results in expression of larval, pupal and adult characters in the same insects. Tcbr dsRNA was injected into the final instar larvae (at 24 h) and SEM images of various organs are compared with wild-type larval/pupal/adult counterparts (a–l). (a–d) Head and thoracic region, (e–h) antennae and (i–l) mouthparts. All panels show ventral side of insects orienting head to the top and abdomen to the bottom. (a–d) well developed thoracic sternal plates (white star). (e–h) Flagellar segments of the antenna (white arrow) and hygroscopic receptors wherever present (white star). (i–l) Mandibles (Mn), labrum (Lb), maxilla (Mx) and labium (Lm); absence of gaps between incisors observed in the pupal mandibles (j, white arrow line); interlocking of mandibles (k and l, white star). Scale bar: (a–d) 100 μm; (e–h) 20 μm; (i–l) 100 μm.
Fig. 7
Fig. 7
Knock-down in Tcbr expression affects cuticular structures as well as differentiation of legs and wings. Tcbr dsRNA was injected into the final instar larvae (at 24 h) Panels show SEM images of wings (a–d), legs (g–h) and abdominal cuticle (i–l) in insects injected with Tcbr dsRNA and uninjected larva, pupa and adults. (a–d) The lateral view and (e–l) the ventral view of insects. (b–d)Wings are denoted by white star. (e–h) Femur segment (white arrow); claw (white star). (i–l) Abdominal cuticular structures; long setae (i and l, white arrow); gin-traps (j, white star); short setae (j, white arrow); sensory bristles (k and l, white star). See text or Table 3 for description. Scale bar: (a–d) 200 μm; (e–h) 50 μm; (i–l) 50 μm.
Fig. 8
Fig. 8
Knock-down in Tcbr expression does not block development of genital papillae and modification of urogomphi. Tcbr dsRNA was injected into the final instar larvae (at 24 h). Panels show SEM images of ventral side of abdominal distal segments of wild-type larva (a), male pupa (b), female pupa (e), female adult (d) and Tcbr RNAi male (c) and female insects (f). Male genital papillae (b and c, white arrow) and female genital papillae (e and f, white arrow) are shown. (a) Included to show the pair of pygopods (white arrow-head) present only in larval stages. Wild-type adult male is not shown as the genital papillae are concealed. (a–f) The distal abdominal segment (white diamond) and urogomphi (white star). See text or Table 3 for description. Scale bar: 50 μm.
Fig. 9
Fig. 9
Knock-down in Tcbr expression affects midgut remodeling. Tcbr dsRNA or malE (control) dsRNA was injected at 24 and 72 h AEFL. Cross-sections (CS, 10 μm thick) of midguts dissected from insects dissected 5 days after dsRNA injection and nuclear stained with DAPI are shown (a–d). (a and b) The comparison of CS of midgut dissected from insects injected with Tcbr dsRNA at 24 h AEFL. (c and d) Midguts dissected from insects injected with Tcbr dsRNA at 72 h AEFL. The pupal/adult cells (pink arrow head) and larval cells (white arrow) are shown (a–d). Note the formation of crypt-like evagination (d, yellow star) in the midgut dissected from larvae injected with Tcbr dsRNA at 72 h AEFL. Scale bar: 50 μm.
Fig. 10
Fig. 10
Effect of Tcbr RNAi on the cell proliferation of midgut. Cell proliferation assay was performed using BrdU. BrdU was administered in insects injected with Tcbr or malE (control) dsRNA after four days of injection. The detection of proliferating cells was performed using anti-BrdU primary antibody and Texas-Red conjugated secondary antibody. Panels show nuclear staining by DAPI (a, d, g and j), proliferating cells staining by BrdU (b, e, h and k) and overlay of both (c, f, i and l). Injection of Tcbr dsRNA at 24 AEFL blocked cell proliferation in midgut and only a few BrdU positive cells were observed (b) when compared to its control (e). Injection of Tcbr dsRNA at 72 h AEFL showed midgut in advanced state of proliferation with evagination of crypts (h) when compared to its control (k). Only proliferating imaginal cells were detected by BrdU (white in overlay images); larval or differentiated pupal cells remain unstained (blue in overlay images). Controls include insects not injected with BrdU (not shown). Scale bar: 20 μm.
Fig. 11
Fig. 11
Relative florescence intensity (RFI) of proliferating cells in in vitro cultured midguts dissected from insects injected with Tcbr or malE dsRNA exposed to DMSO, 20E, JH III or 20E + JH III and quantified using BrdU labeling. RFI was measured using Olympus Flouview software version 1.5. Squares of constant area (6662mm2) and length (26 mm) were drawn on composite Z-stack images. The average intensity in the marked area against the background was measured using the software. All other parameters (PMT, Gain, Offset, zoom) were the same for each image documented. Mean ± SE of three independent experiments (n = 15) are shown.

Similar articles

Cited by

References

    1. Arakane Y, Muthukrishnan S, Kramer KJ, Specht CA, Tomoyasu Y, Lorenzen MD, Kanost M, Beeman RW. The Tribolium chitin synthase genes TcCHS1 and TcCHS2 are specialized for synthesis of epidermal cuticle and midgut peritrophic matrix. Insect Mol Biol. 2005;14:453–463. - PubMed
    1. Ashburner M. Effects of juvenile hormone on adult differentiation of Drosophila melanogaster. Nature. 1970;227:187–189. - PubMed
    1. Baker FC, Tsai LW, Reuter CC, Schooley DA. In vivo fluctuations of JH, JH acid, and ecdysteroid titer, and JH esterase activity during development of the fifth stadium Manduca sexta. Insect Biochem. 1987;17:989–996.
    1. Bayer CA, von Kalm L, Fristrom JW. Relationships between protein isoforms and genetic functions demonstrate functional redundancy at the BroadComplex during Drosophila metamorphosis. Dev Biol. 1997;187:267–282. - PubMed
    1. Beckstead RB, Lam G, Thummel CS. The genomic response to 20-hydroxyecdysone at the onset of Drosophila metamorphosis. Genome Biol. 2005;6:R99. - PMC - PubMed

Publication types

MeSH terms

LinkOut - more resources