

Dose-response relationship of ultrasound contrast agent in an in vivo murine melanoma model
- PMID: 18083651
- PMCID: PMC2151329
- DOI: 10.1102/1470-7330.2007.0031
Dose-response relationship of ultrasound contrast agent in an in vivo murine melanoma model
Abstract
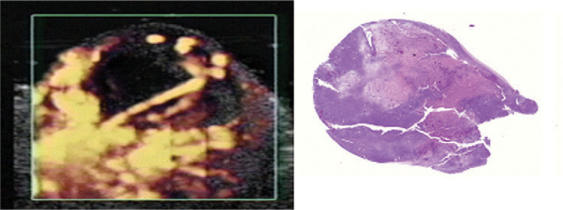
Many factors affect the sensitivity and reliability of tumor vasculature assessment at the small doses of contrast agent necessary for imaging mice. In this study we investigate the dose-response relationship of ultrasound contrast agent for a minimal exposure power Doppler technique (minexPD) in a murine melanoma model. K1735 murine melanomas grown in 25 C3H/HeN mice were imaged by power Doppler ultrasound using different doses of contrast agents, Optison(R) and Definity(R). Six mice were treated with an antivascular agent, combretastatin A4-phosphate (CA4P), and imaged before and after treatment. The color-weighted fractional area (CWFA) of the peak-enhanced image was measured to assess tumor perfusion on a relative scale of 0 to 100. CWFA increased logarithmically with dose (R(2)=0.97). Treatment with CA4P resulted in pronounced reduction in tumor perfusion 2 h after contrast injection, but perfusion recovered in the tumor periphery after 2 days. CWFA was significantly different between pre- and post-treatment for all doses at 2 h and 2 days (p < 0.05, respectively). There was no significant difference detectable between the two contrast agents, Optison(R) and Definity(R) (p = 0.46). In vivo tumor enhancement in mice increases as logarithmic function with dose. Although the extent of enhancement is dose dependent, the difference between pre- and post-therapy enhancement is relatively unchanged and uniform at varying doses. The two contrast agents tested in this study performed equally well. These results suggest that quantitative contrast-enhanced power Doppler imaging is an effective method for monitoring therapy response of tumors in mice.
Figures


Similar articles
-
The antivascular action of physiotherapy ultrasound on a murine tumor: role of a microbubble contrast agent.Ultrasound Med Biol. 2007 Dec;33(12):1901-10. doi: 10.1016/j.ultrasmedbio.2007.06.013. Epub 2007 Aug 27. Ultrasound Med Biol. 2007. PMID: 17720299 Free PMC article.
-
The antivascular action of physiotherapy ultrasound on murine tumors.Ultrasound Med Biol. 2005 Oct;31(10):1403-10. doi: 10.1016/j.ultrasmedbio.2005.06.008. Ultrasound Med Biol. 2005. PMID: 16223644 Free PMC article.
-
Vascularization of liver tumors - preliminary results with Coded Harmonic Angio (CHA), phase inversion imaging, 3D power Doppler and contrast medium-enhanced B-flow with second generation contrast agent (Optison).Clin Hemorheol Microcirc. 2006;34(4):483-97. Clin Hemorheol Microcirc. 2006. PMID: 16687788 Clinical Trial.
-
Combretastatin A4 phosphate: a novel vascular disrupting agent.Future Oncol. 2010 Aug;6(8):1219-28. doi: 10.2217/fon.10.90. Future Oncol. 2010. PMID: 20799867 Review.
-
Combretastatin A4 phosphate.Anticancer Drugs. 2004 Mar;15(3):179-87. doi: 10.1097/00001813-200403000-00001. Anticancer Drugs. 2004. PMID: 15014350 Review.
Cited by
-
Assessment and monitoring tumor vascularity with contrast-enhanced ultrasound maximum intensity persistence imaging.Invest Radiol. 2011 Mar;46(3):187-95. doi: 10.1097/RLI.0b013e3181f9202d. Invest Radiol. 2011. PMID: 21150790 Free PMC article.
-
Tumor endothelial marker 1-specific DNA vaccination targets tumor vasculature.J Clin Invest. 2014 Apr;124(4):1497-511. doi: 10.1172/JCI67382. Epub 2014 Mar 18. J Clin Invest. 2014. PMID: 24642465 Free PMC article.
References
-
- Folkman J. Tumor angiogenesis: therapeutic implications. N Engl J Med. 1971;285:1182–6. - PubMed
-
- Nyberg P, Xie L, Kalluri R.2 Endogenous inhibitors of angiogenesis. Cancer Res. 2005;65:3967–79. - PubMed
-
- Cao Y. Antiangiogenic cancer therapy. Semin Cancer Biol. 2004;14:139–45. - PubMed
-
- Tozer GM. Measuring tumour vascular response to antivascular and antiangiogenic drugs. Br J Radiol. 2003;76:S23–35. - PubMed
-
- Rehman S, Jayson GC. Molecular imaging of antiangiogenic agents. The Oncologist. 2005;10:92–103. - PubMed
Publication types
MeSH terms
Substances
Grants and funding
LinkOut - more resources
Full Text Sources