. 2008 Feb 22;283(8):4744-55.
doi: 10.1074/jbc.M709956200. Epub 2007 Dec 14.

Activation of cytosolic phospholipase A2alpha in resident peritoneal macrophages by Listeria monocytogenes involves listeriolysin O and TLR2

Affiliations

Activation of cytosolic phospholipase A2alpha in resident peritoneal macrophages by Listeria monocytogenes involves listeriolysin O and TLR2

Shahid Noor et al. J Biol Chem. .

Abstract

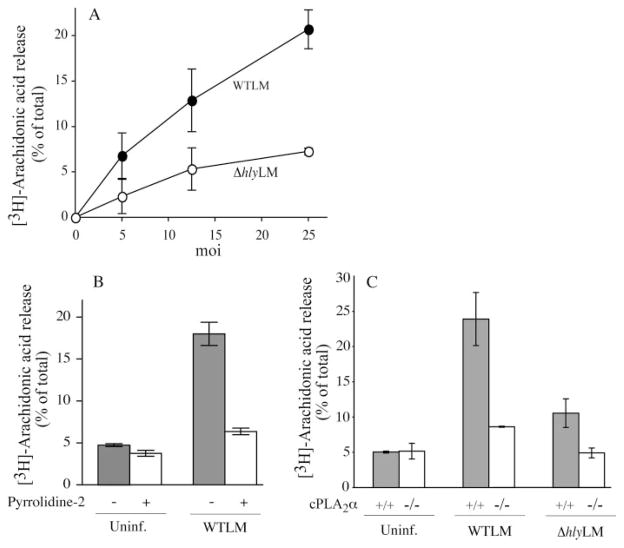
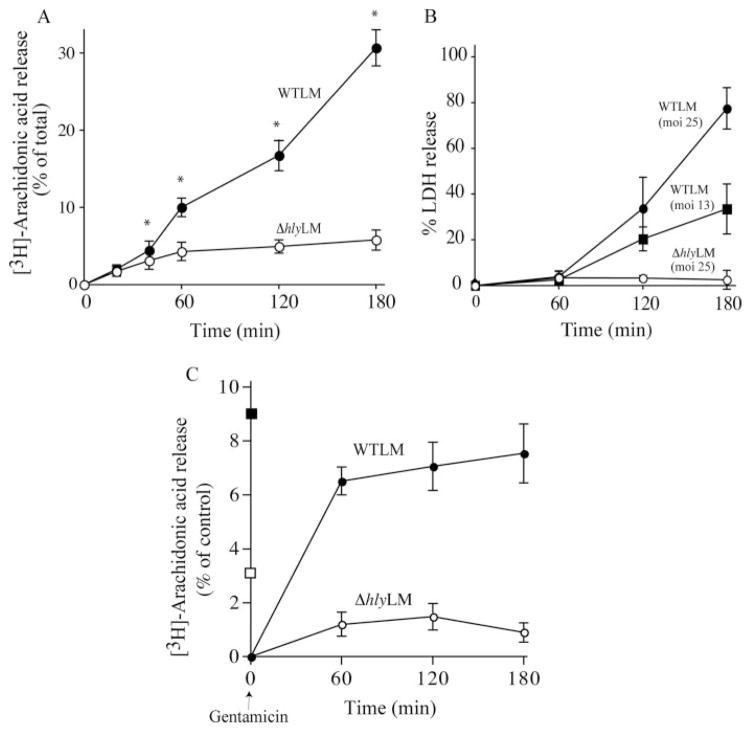
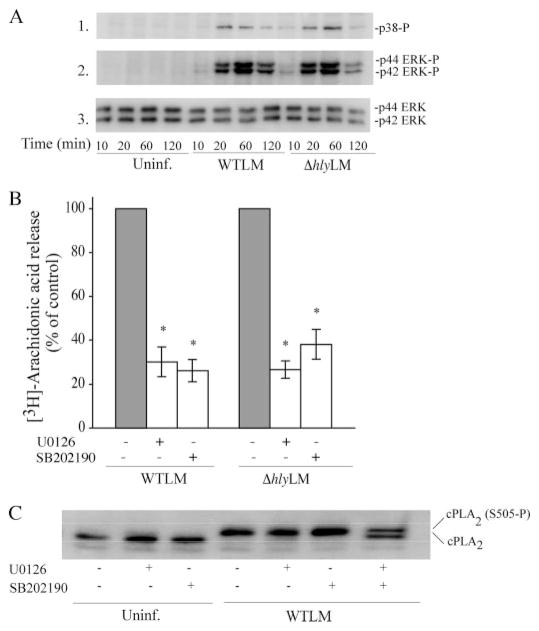
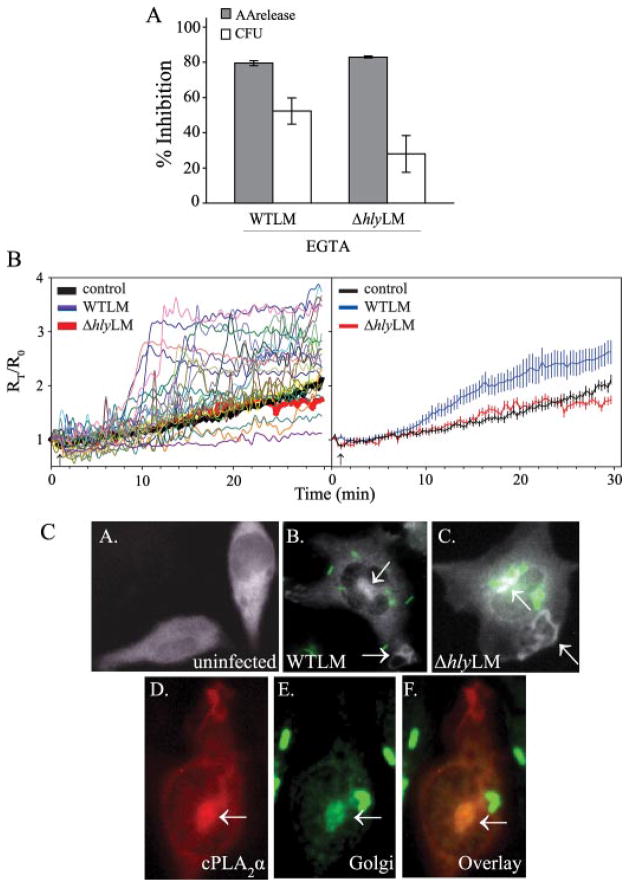
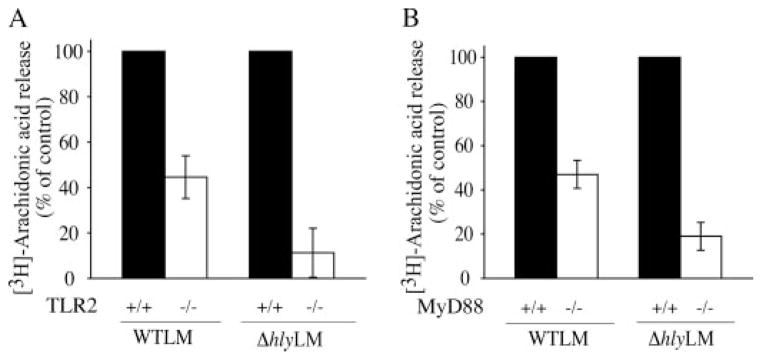
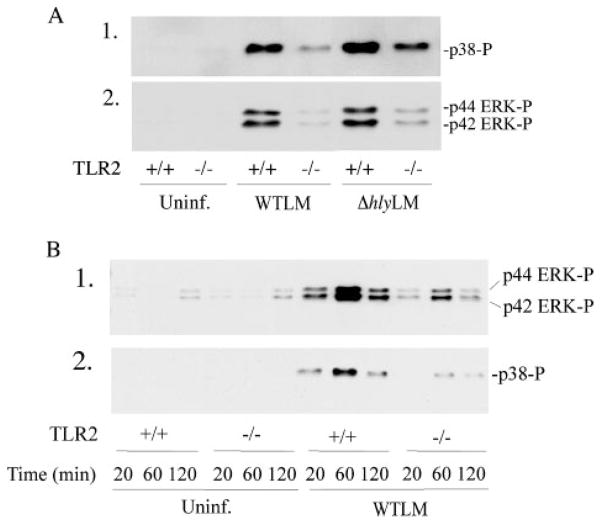
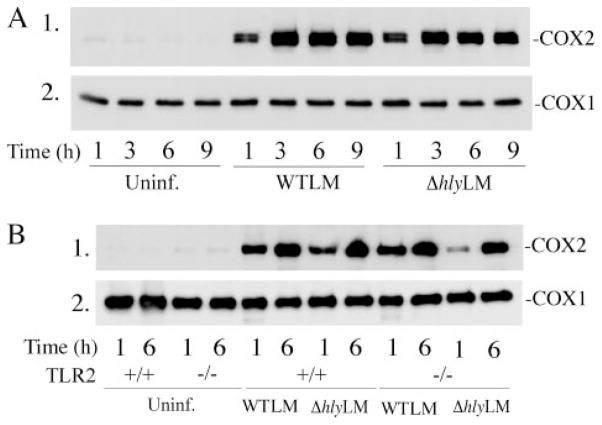
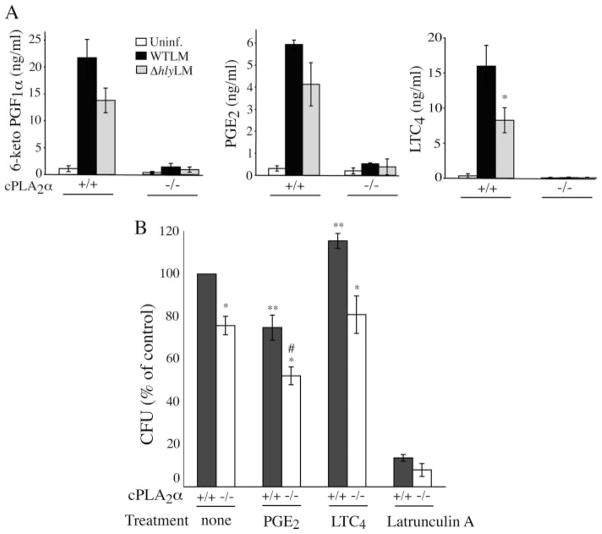
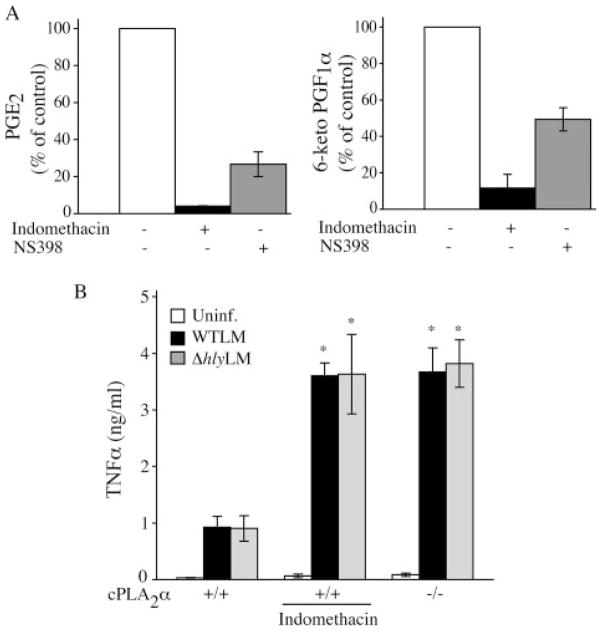
Eicosanoid production by macrophages is an early response to microbial infection that promotes acute inflammation. The intracellular pathogen Listeria monocytogenes stimulates arachidonic acid release and eicosanoid production from resident mouse peritoneal macrophages through activation of group IVA cytosolic phospholipase A2 (cPLA2alpha). The ability of wild type L. monocytogenes (WTLM) to stimulate arachidonic acid release is partially dependent on the virulence factor listeriolysin O; however, WTLM and L. monocytogenes lacking listeriolysin O (DeltahlyLM) induce similar levels of cyclooxygenase 2. Arachidonic acid release requires activation of MAPKs by WTLM and DeltahlyLM. The attenuated release of arachidonic acid that is observed in TLR2-/- and MyD88-/- macrophages infected with WTLM and DeltahlyLM correlates with diminished MAPK activation. WTLM but not DeltahlyLM increases intracellular calcium, which is implicated in regulation of cPLA2alpha. Prostaglandin E2, prostaglandin I2, and leukotriene C4 are produced by cPLA2alpha+/+ but not cPLA2alpha-/- macrophages in response to WTLM and DeltahlyLM. Tumor necrosis factor (TNF)-alpha production is significantly lower in cPLA2alpha+/+ than in cPLA2alpha-/- macrophages infected with WTLM and DeltahlyLM. Treatment of infected cPLA2alpha+/+ macrophages with the cyclooxygenase inhibitor indomethacin increases TNFalpha production to the level produced by cPLA2alpha-/- macrophages implicating prostaglandins in TNFalpha down-regulation. Therefore activation of cPLA2alpha in macrophages may impact immune responses to L. monocytogenes.


Figures

FIGURE 1
FIGURE 1. L. monocytogenes stimulates cPLA2α-mediated arachidonic acid release from mouse peritoneal macrophages
Macrophages labeled with [3H]arachidonic acid were infected for 60 min with the indicated m.o.i. of WTLM or ΔhlyLM (A) or WTLM and ΔhlyLM (m.o.i. 25) (B and C). B, macrophages were incubated for 30 min with and without 5 μM pyrrolidine-2 prior to adding WTLM. C, macrophages isolated from cPLA2α+/+ and cPLA2α−/− mice (C57BL/6/129 mixed strain) were used. Similar results were obtained with macrophages isolated from cPLA2α+/+ and cPLA2α−/− BALB/c mice. The amount of [3H]arachidonic acid released into the medium from infected and uninfected (Uninf.) macrophages was measured and expressed as a percentage of the total incorporated radioactivity. The results are the averages of two independent experiments in triplicate ± S.D.
FIGURE 2
FIGURE 2. Time course of arachidonic acid release and cytotoxicity in response to WTLM and ΔhlyLM
Macrophages were infected with WTLM and ΔhlyLM (m.o.i. 25), and release of [3H]arachidonic acid (A) and LDH (B) was monitored at the indicated times after infection in the absence of gentamicin. C, [3H]Arachidonic acid-labeled macrophages were incubated with WTLM or ΔhlyLM for 60 min, washed, and then incubated in fresh medium containing 50 μg/ml gentamicin. The amount of [3H]arachidonic acid released was determined after the initial 60 min of infection in the absence of gentamicin in response to WTLM (■) or ΔhlyLM (□), and then at the indicated times after washing and addition of fresh medium containing gentamicin (50 μg/ml). The amount of [3H]arachidonic acid released into the medium from infected and uninfected cells was measured and expressed as a percentage of the total incorporated radioactivity after subtracting background arachidonic acid release from uninfected macrophages. The results are the averages of three experiments ±S.E. (A and C) or the averages of two experiments ±S.D. (B). [3H]arachidonic acid release because of WTLM and ΔhlyLM was insignificant at 20 min but was significantly (*, p < 0.05) higher in response to WTLM than ΔhlyLM at 40 min and thereafter (A).
FIGURE 3
FIGURE 3. Role of L. monocytogenes internalization in regulating arachidonic acid release
[3H]Arachidonic acid-labeled (open bars) or unlabeled macrophages (gray bars) were incubated in the absence or presence of 0.1 μM wortmannin (A), or 0.1 or 1.0 μM latrunculin A (B) for 30 min. After 60 min of incubation with WTLM and ΔhlyLM (m.o.i. 25), [3H]arachidonic acid (AA) release (open bars) or bacterial uptake (CFU) (gray bars) were measured. The results are averages ±S.E. of a minimum of three independent experiments. The data are expressed as the % inhibition relative to WTLM or ΔhlyLM controls not treated with inhibitors. WTLM- and ΔhlyLM-infected control macrophages released 18.5 and 10.5% AA (A) and 19.3 and 10.9% AA (B), respectively. There was significantly (*, p < 0.05) less inhibition of [3H]arachidonic acid release by latrunculin A (0.1 and 1.0 μM) from macrophages stimulated with WTLM than ΔhlyLM.
FIGURE 4
FIGURE 4. Activation of ERKs and p38 by WTLM and ΔhlyLM contributes to cPLA2α-mediated AA release
A, cell lysates were prepared from uninfected (Uninf.) or L. monocytogenes-infected macrophages (m.o.i. 25) at the indicated times. Activation of MAPKs was determined by probing for phosphorylated p38 (p38-P) or ERKs (ERK-P) on Western blots using phosphospecific antibodies. The samples were probed for total ERK protein (panel 3) as a control for sample loading. B, [3H]arachidonic acid-labeled macrophages were preincubated with vehicle (Me2SO), 10 μM U0126 for 15 min, or 10 μM SB202190 for 60 min followed by infection (m.o.i. 25) with WTLM or ΔhlyLM for 60 min. The amount of [3H]arachidonic acid released into the media is expressed as a percentage of release from control macrophages (gray bars) not treated with inhibitors (100%). WTLM- and ΔhlyLM-infected control macrophages not treated with inhibitors released 18.6 and 8.4% AA, respectively. C, cPLA2α gel shift was analyzed by immunoblotting lysates from macrophages treated as described above. Results are representative of two independent experiments (A and C) or the averages ± S.E. of three independent experiments (B). Arachidonic acid release was significantly lower (*, p < 0.05) from macrophages treated with MAPK inhibitors compared with controls (B).
FIGURE 5
FIGURE 5. Role of calcium in regulating cPLA2α activation by L. monocytogenes
A, [3H]arachidonic acid-labeled (gray bars) or unlabeled macrophages (open bars) were incubated in the absence or presence of 10 mM EGTA for 15 min. After a 60-min incubation with WTLM and ΔhlyLM (m.o.i. 25), [3H]AA release or bacterial uptake (CFU) was measured. The amount of [3H]AA released into the media is expressed as a percentage of release from control macrophages (gray bars) not treated with EGTA (100%). WTLM- and ΔhlyLM-infected macrophages not treated with EGTA released 21.4 and 8.8% AA, respectively. The results are averages ±S.E. of three independent experiments. There was significantly (p < 0.05) less [3H]AA release and CFU from macrophages in the presence of EGTA. B, macrophages loaded with Fura Red-AM were incubated without (control) or with (m.o.i. 25) WTLM or ΔhlyLM. [Ca2+]i changes were determined by live cell imaging and calculated as a ratio of the fluorescence intensities of bound to unbound calcium (F403/F490). Each point is expressed relative to time 0 (Rt/R0). In the graph on the left, data from 16 to 25 control (solid black line) or ΔhlyLM infected (solid red line) macrophages were averaged. For macrophages infected with WTLM, data from individual macrophages are shown as different colored lines. In the graph on the right, averages ± S.E. are shown. C, macrophages expressing ECFP-cPLA2α were incubated without (uninfected, panel A) or with (m.o.i. 25) EGFP-WTLM (panel B) or ΔhlyLM (panel C) for 60 min and then fixed for fluorescence microscopy. For visualizing ΔhlyLM (panel C) or WTLM shown in panels E and F, macrophages were probed with antibody to L. monocytogenes. Panel D shows macrophages expressing ECFP-cPLA2α (shown as pseudo-red) after incubation with WTLM for 30 min. The same cell probed with rabbit polyclonal antibodies to the Golgi marker Giantin (pseudo-green) and to L. monocytogenes followed by Texas Red secondary antibody (shown as pseudo-green) is shown in panel E. Although the secondary antibody depicts both Golgi and L. monocytogenes, bacteria are readily distinguished from Golgi (arrow), where localization of cPLA2α is evident (overlay, panel F).
FIGURE 6
FIGURE 6. Role of TLR2 and MyD88 in regulating arachidonic acid release in response to WTLM and ΔhlyLM
[3H]Arachidonic acid-labeled resident mouse peritoneal macrophages isolated from wild type (solid bars), TLR2−/− (open bars) (A) or MyD88−/−(open bars) (B) mice were infected (m.o.i. 25) with WTLM or ΔhlyLM for 60 min. The amount of [3H]arachidonic acid released into the media is expressed as a percentage of release from wild type macrophages (100%). WTLM- and ΔhlyLM-infected wild type macrophages released 13.9 and 6.1% AA (A) and 23.2 and 12.5% AA (B), respectively. Results are the averages ± S.D. of two independent experiments.
FIGURE 7
FIGURE 7. TLR2 regulates p38 and ERK activation in macrophages infected with WTLM and ΔhlyLM
Resident mouse peritoneal macrophages isolated from TLR2−/−and TLR2−/−mice were infected (m.o.i. 25) with WTLM or ΔhlyLM for 60 min (A) or for the times indicated (B). Activation of MAPKs was determined by probing for phosphorylated p38 (p38-P) or ERKs (ERK-P) on Western blots using phospho-specific antibodies. Uninf, uninfected.
FIGURE 8
FIGURE 8. COX2 expression is induced by WTLM and ΔhlyLM and is independentofTLR2
Resident mouse peritoneal macrophages isolated from ICR (A) and TLR2−/−and TLR2+/+mice (B) were infected (m.o.i. 25) with WTLM or ΔhlyLM. After a 1-h incubation with L. monocytogenes, the macrophages were washed and then incubated in medium containing gentamicin. Expression of COX2 and COX1 was determined by Westernblotting of macrophage lysates prepared at the times indicated after addition of L. monocytogenes. Uninf, uninfected.
FIGURE 9
FIGURE 9. cPLA2α is required for eicosanoid production by macrophages infected with L. monocytogenes
A, resident peritoneal macrophages isolated from cPLA2α−/− and cPLA2α−/− mice (BALB/c) were incubated with WTLM or ΔhlyLM (m.o.i. 25) for 60 min, washed, and then incubated in fresh medium containing gentamicin. Levels of PGE2, 6-keto prostaglandin F1α (6-keto PGF1α, the stable metabolite of PGI2), and leukotriene C4 (LTC4) were measured in the culture medium collected 3 h after adding L. monocytogenes. The results are the averages ± S.E. of five independent experiments for cPLA2α+/+ macrophages and averages ± S.D. of two experiments for cPLA2α−/− macrophages. There was significantly (*, p < 0.05) less LTC4 production by cPLA2α+/+ macrophages infected with ΔhlyLM than WTLM. B, resident peritoneal macrophages isolated from cPLA2α+/+ and cPLA2α−/− mice were incubated with or without (none) PGE2 (4 ng/ml), leukotriene C4 (10 ng/ml), or latrunculin A (1 μM) for 15 before addition of WTLM (m.o.i. 25). After incubation for 1 h, the macrophages were washed six times and lysed with 0.1% Triton X-100 for determination of CFU. The results are the average ± S.E. of at least three independent experiments. There was significantly (*, p < 0.05) less CFU in untreated cPLA2α−/− macrophages than cPLA2α+/+ macrophages and in PGE2- or LTC4-treated cPLA2α−/− macrophages than similarly treated cPLA2α+/+ macrophages. There was significantly (**, p < 0.05) less CFU in cPLA2α+/+ macrophages treated with PGE2 and more CFU in cPLA2α+/+ macrophages treated with LTC4 compared with untreated cPLA2α+/+ macrophages (none). There was significantly (#, p < 0.05) less CFU in cPLA2α−/− macrophages treated with PGE2 than in untreated cPLA2α−/− macrophages. Uninf, uninfected.
FIGURE 10
FIGURE 10. Regulation of TNFα production by prostaglandins
A, resident peritoneal macrophages isolated from cPLA2α+/+ mice were incubated for 30 min with or without 20 μM indomethacin or 10 μM NS398 and then incubated with WTLM for 3 h as described above for Fig. 9A. Control macrophages not treated with inhibitors produced 9.9 ng/ml PGE2 and 9.1 ng/ml 6-keto PGF1α.B, cPLA2α+/+ macrophages, incubated with or without 20 μMindo-methacin, and cPLA2α−/− macrophages incubated without indomethacin, were treated as described in Fig. 9A. The culture media were collected 3 h after adding WTLM or ΔhlyLM for TNFα analysis. Results are the averages of two independent experiments ± S.D. (A) or the averages of three independent experiments ± S.E. (B). cPLA2α−/− macrophages and indomethacin-treated cPLA2α+/+ macrophages produced significantly more (p < 0.05) TNFα production than untreated cPLA2α+/+ macrophages.

Similar articles

Cited by

References

    1. Farber JM, Peterkin PI. Microbiol Rev. 1991;55:476–511. - PMC - PubMed
    1. Vazquez-Boland JA, Kuhn M, Berche P, Chakraborty T, Dominguez-Bernal G, Goebel W, Gonzalez-Zorn B, Wehland J, Kreft J. Clin Microbiol Rev. 2001;14:584–640. - PMC - PubMed
    1. Hamon M, Bierne H, Cossart P. Nat Rev Microbiol. 2006;4:423–434. - PubMed
    1. Dussurget O, Pizarro-Cerda J, Cossart P. Annu Rev Microbiol. 2004;58:611–647. - PubMed
    1. Portnoy DA, Jacks PS, Hinrichs DJ. J Exp Med. 1988;167:1459–1471. - PMC - PubMed

Publication types

MeSH terms