. 2008 Feb;74(3):850-60.
doi: 10.1128/AEM.01495-07. Epub 2007 Dec 14.

Multiple-locus sequence typing and analysis of toxin genes in Bacillus cereus food-borne isolates

Affiliations

Multiple-locus sequence typing and analysis of toxin genes in Bacillus cereus food-borne isolates

Barbara Cardazzo et al. Appl Environ Microbiol. 2008 Feb.

Abstract

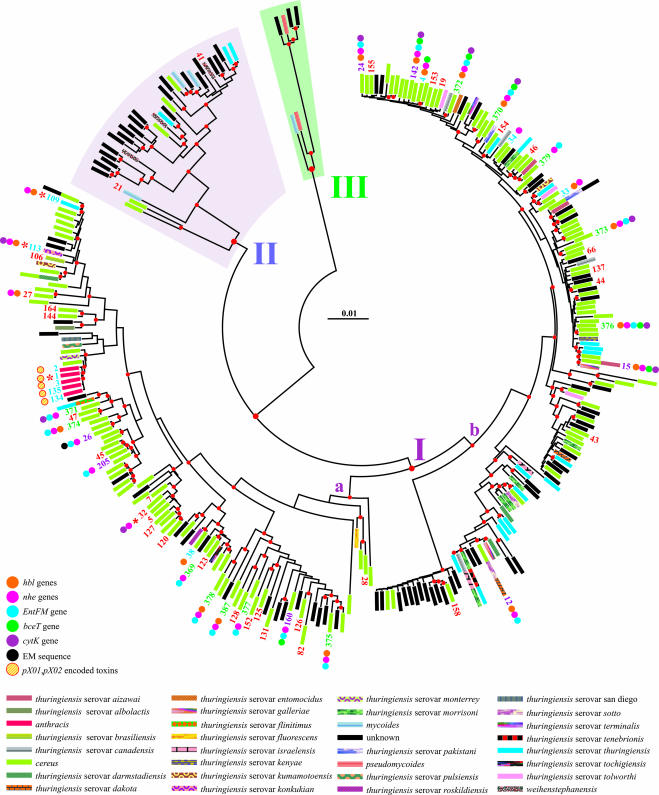
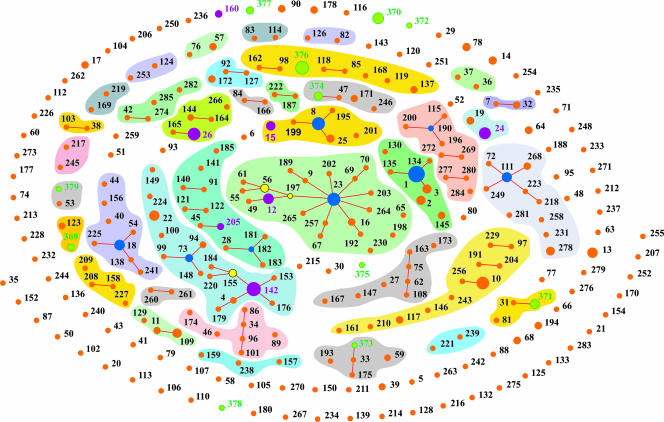
In the present study we characterized 47 food-borne isolates of Bacillus cereus using multilocus sequence typing (MLST). Newly determined sequences were combined with sequences available in public data banks in order to produce the largest data set possible. Phylogenetic analysis was performed on a total of 296 strains for which MLST sequence information is available, and three main lineages--I, II, and III--within the B. cereus complex were identified. With few exceptions, all food-borne isolates were in group I. The occurrence of horizontal gene transfer (HGT) among various strains was analyzed by several statistical methods, providing evidence of widespread lateral gene transfer within B. cereus. We also investigated the occurrence of toxin-encoding genes, focusing on their evolutionary history within B. cereus. Several patterns were identified, indicating a pivotal role of HGT in the evolution of toxin-encoding genes. Our results indicate that HGT is an important element in shaping the population structure of the B. cereus complex. The results presented here also provide strong evidence of reticulate evolution within the B. cereus complex.


Figures

FIG. 1.
FIG. 1.
Phylogeny of the B. cereus group. An NJ tree depicts the phylogenetic relationships among unique MLST isolates. The scale bar shows the distance calculated according to the Tamura and Nei evolutionary model. Major clusters are numbered arbitrarily I, II, and III. Nodes supported by bootstrap values of >50% are marked with a red dot. Different toxin genes and species are labeled according to the self-explanatory color scheme listed below the tree. ST labels defining isolates were omitted to avoid overcrowding. Exceptions are represented by newly determined unique isolates (green), new isolates with a counterpart in the public database (purple), food-borne isolates (red), and public isolates (blue), for which toxin data are available in the literature. The distribution of toxins and toxin genes is not known for most of the food-borne isolates labeled here. The distribution of toxins and toxin genes is also currently unknown for the unlabeled STs depicted in this figure. An ST marked with a red asterisk indicates that at least a full-length genome sequence is available in GenBank for an isolate with the same ST profile.
FIG. 2.
FIG. 2.
Population snapshot of the B. cereus group. Numbers refer to the ST allelic profiles (newly determined or available in the MLST database). Clusters of linked isolates correspond to potential CCs (i.e., STs sharing at least six identical alleles) (18). Primary founders, colored blue except for 142, which is purple (see below), are positioned centrally in the cluster, and subgroup founders are shown in yellow. Newly determined unique isolates are green, while new isolates with a counterpart in the public database are shown in purple. ST profiles sharing at least five identical alleles are grouped according to a common color background. STs present only in a public B. cereus MLST database are shown in orange. Dot sizes are proportional to the number of isolates with the same ST allelic profile.
FIG. 3.
FIG. 3.
Distribution of potential CCs, identified by eBurst analysis, on the NJ tree. The scale bar indicates distance calculated according to the Tamura and Nei evolutionary model. The 35 complexes of ST profiles obtained through eBurst analysis were mapped on the phylogenetic tree previously produced with MEGA program. The species legend listed below the tree is identical to that provided in Fig. 1. Numbers at the tip of the tree terminal branches refer to the corresponding ST profiles labeled according to the scheme provided in the MLST database dedicated to B. cereus (http://pubmlst.org/bcereus/). CCs are labeled according to the eBurst results (see the supplemental material).

References

    1. Agata, N., M. Ohta, Y. Arakawa, and M. Mori. 1995. The bceT gene of Bacillus cereus encodes an enterotoxin protein. Microbiology 141:983-988. - PubMed
    1. Altschul, S. F., W. Gish, W. Miller, E. W. Myers, and D. J. Lipman. 1990. Basic local alignment search tool. J. Mol. Biol. 215:403-410. - PubMed
    1. Anonymous. 2004. Microbiology of food and animal feeding stuffs—horizontal method for enumeration of presumptive Bacillus cereus—colony-count technique at 30°C. Document ISO 7932. International Organization for Standardization, Geneva, Switzerland.
    1. Asano, S. I., Y. Nukumizu, H. Bando, T. Iizuka, and T. Yamamoto. 1997. Cloning of novel enterotoxin genes from Bacillus cereus and Bacillus thuringiensis. Appl. Environ. Microbiol. 63:1054-1057. - PMC - PubMed
    1. Barker, M., B. Thakker, and F. G. Priest. 2005. Multilocus sequence typing reveals that Bacillus cereus strains isolated from clinical infections have distinct phylogenetic origins. FEMS Microbiol. Lett. 245:179-184. - PubMed

MeSH terms

LinkOut - more resources