. 2008 Jan;11(1):80-7.
doi: 10.1038/nn2030. Epub 2007 Dec 16.

Activity-dependent gating of lateral inhibition in the mouse olfactory bulb

Affiliations

Activity-dependent gating of lateral inhibition in the mouse olfactory bulb

Armen C Arevian et al. Nat Neurosci. 2008 Jan.

Abstract

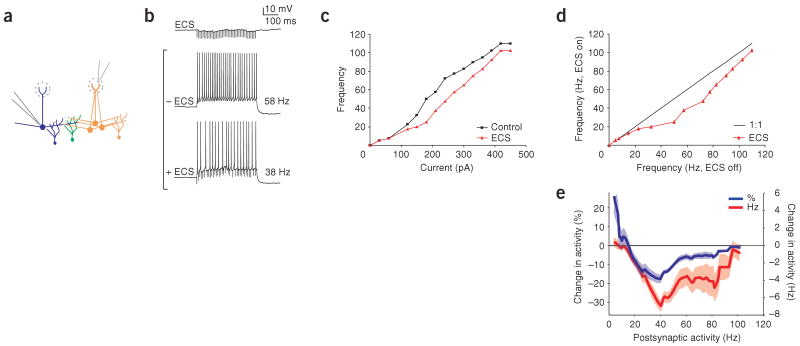
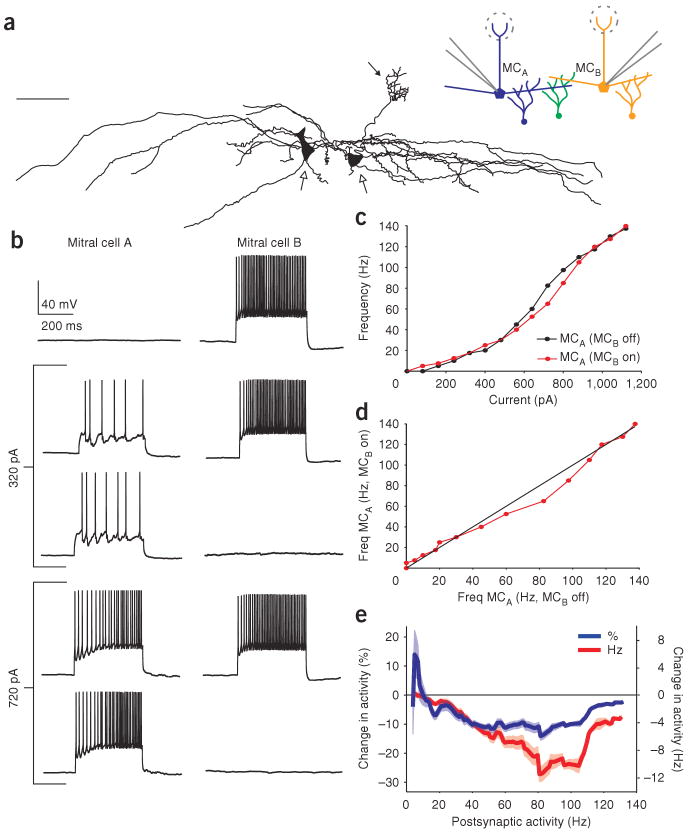
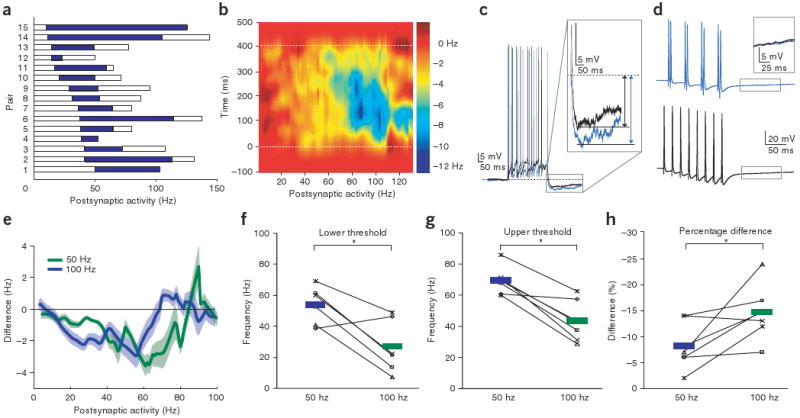
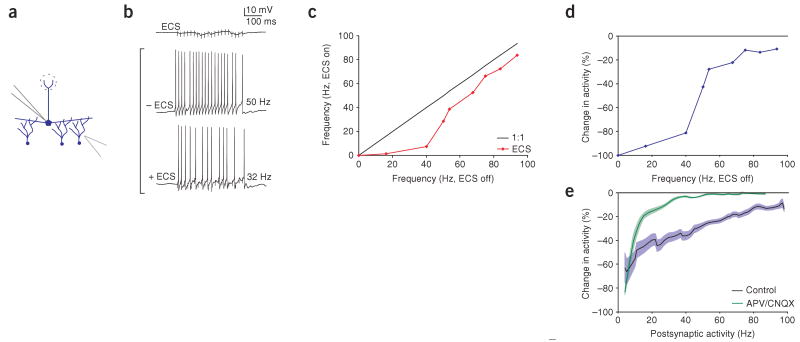
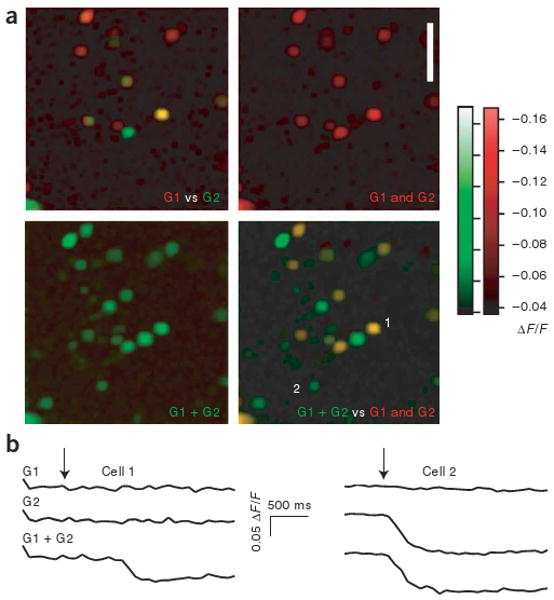
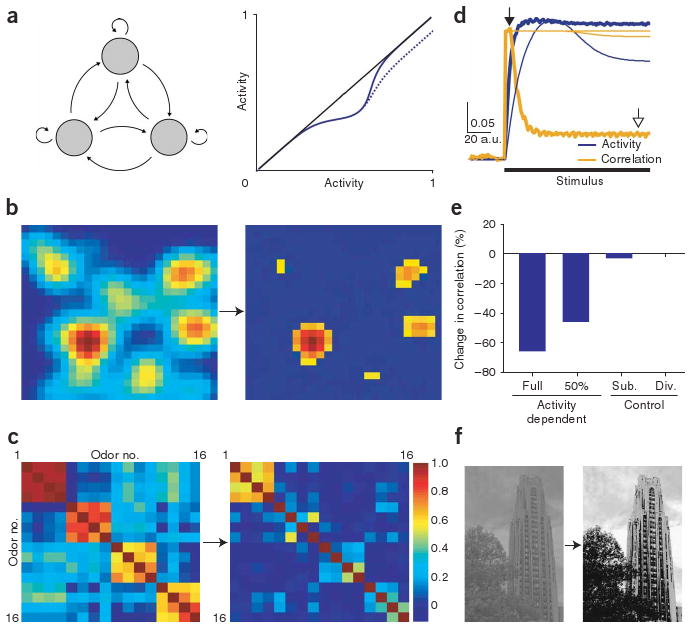
Lateral inhibition is a circuit motif found throughout the nervous system that often generates contrast enhancement and center-surround receptive fields. We investigated the functional properties of the circuits mediating lateral inhibition between olfactory bulb principal neurons (mitral cells) in vitro. We found that the lateral inhibition received by mitral cells is gated by postsynaptic firing, such that a minimum threshold of postsynaptic activity is required before effective lateral inhibition is recruited. This dynamic regulation allows the strength of lateral inhibition to be enhanced between cells with correlated activity. Simulations show that this regulation of lateral inhibition causes decorrelation of mitral cell activity that is evoked by similar stimuli, even when stimuli have no clear spatial structure. These results show that this previously unknown mechanism for specifying lateral inhibitory connections allows functional inhibitory connectivity to be dynamically remapped to relevant populations of neurons.


Figures

Figure 1
Figure 1
Activity-dependent gating of lateral inhibition. (a) Schematic of experimental configuration. Whole-cell recording of a single mitral cell (blue cell, postsynaptic cell) during application of extracellular stimulation (ECS) in the glomerular layer, activating a population of presynaptic mitral cells (orange cells). Mitral cells were disynaptically connected via the shared population of granule cells (green cells). (b) ECS evoked IPSPs in the recorded mitral cell and resulted in inhibition of firing rate for a given current step. The control firing rate (58 Hz) was reduced (to 38 Hz) by ECS. (c,d) Effectiveness of ECS in reducing mitral cell firing rate is shown by plotting F-I curves (red line with ECS and black line without ECS, c) and by plotting frequency with and without ECS for the same current steps (d). (e) Percentage change (blue line), as well as absolute change, in activity (red line) as a function of firing rate averaged across recordings. Shaded areas for this and subsequent figures indicate s.e.m.
Figure 2
Figure 2
Activity-dependent gating of lateral inhibition in mitral cell pairs. (a) Tracings from a biocytin-filled mitral-cell pair (scale bar, 75 μm). Open arrows indicate cell bodies, filled arrow indicates tuft of one mitral cell; the other cell had a cut primary dendrite. Inset, schematic of experiment. Whole-cell recording from pairs of mitral cells disynaptically connected via the shared population of granule cells are shown in green. (b) Activation of a single presynaptic mitral cell (mitral cell B, MCB) did not result in IPSPs in the postsynaptic cell (mitral cell A, MCA). Similarly, MCB was ineffective at inhibiting MCA when MCA was firing at 32 Hz. However, at 85 Hz, MCB was able to reduce the firing rate of MCA to 65 Hz, representing a 24% reduction. (c) This activity-dependent inhibition is illustrated by comparing the F-I curves for the control condition (MCB off, red line) to the case when MCB is activated (MCB on, black line). (d) Firing rate of MCA, plotted with respect to the two conditions tested, showing a selective reduction in the firing rate of MCA only between 45 and 110 Hz. (e) Percentage (blue line) and absolute change in activity (red line) as a function of firing rate, averaged across paired recordings.
Figure 3
Figure 3
Summary results of activity-dependent lateral inhibition. (a) Data from 15 mitral cell pairs showing lateral inhibition. The range of inhibition is plotted with respect to postsynaptic activity. White bars indicate the range of postsynaptic activity recorded, whereas blue bars indicate the frequencies of activity-dependent inhibition (defined as a ≥5% reduction in firing rate). (b) Difference in spike-density functions for paired recordings showing instantaneous inhibition with respect to postsynaptic activity and time. (c) Example of increased recurrent inhibition during paired mitral-cell stimulation. The black trace shows the control recurrent IPSP and the blue trace shows the recurrent IPSP recorded during stimulation of presynaptic cell. (d) Pairs of correlated spikes (blue trace) were not more effective at recruiting granule cell activity than distributed spikes (black trace). (e) Activity-dependent range of inhibition between pairs can be modulated by presynaptic firing rate (presynaptic firing rate of 50 Hz in green and 100 Hz in blue). (fh) Lower and upper thresholds of the activity-dependent range of inhibition were reduced by increasing presynaptic mitral-cell firing rate while the peak percentage change in activity was increased.
Figure 4
Figure 4
Lateral inhibition evoked by direct stimulation of granule cells. (a) Schematic of experimental configuration. We recorded from a single mitral cell while extracellular stimulation (ECS) was applied in the granule cell layer ∼ 200–300 mm away. (b) ECS resulted in IPSPs in the mitral cell, and for a given current step ECS reduced the mitral-cell firing rate (50 Hz control firing rate was reduced to 32 Hz when ECS was applied). (c,d) Frequency dependence of inhibition for this example, plotted as the absolute change in frequency (c) and as the percent reduction (d). (e) Aggregate results (n = 9 for control in blue and n = 4 for APV/CNQX in green) indicated that inhibition evoked via ECS in the granule cell layer showed saturation with increasing postsynaptic frequency, but did not show activity-dependent gating at lower frequencies.
Figure 5
Figure 5
Overlapping and cooperative activation of granule cells following mitral cell stimulation. (a) Imaging of bulk-loaded calcium indicator (fura-2) from a population of granule cell–layer neurons. Images show calcium-induced changes in fluorescence (ΔF/F) from populations of granule cells (images show minimum values for a given pixel across ten trials). The top left image shows the population of granule cells that were activated by stimulation of one glomerulus (G1, red) and a second glomerulus (G2, green). Yellow cells were activated by stimulation of either glomerulus. Top right, merged image in the red channel (G1 and G2). Bottom left, the population of granule cells evoked by simultaneous stimulation of both glomeruli (G1 + G2). Bottom right, the overlay of images from top right and bottom left. This overlay shows the population of granule cells that were activated only by simultaneous stimulation (in green). (b) Calcium transients from two cells shown in the images in a. Cells are labeled 1 and 2 in lower right panel of a. Arrows indicate time of stimulation.
Figure 6
Figure 6
Activity-dependent lateral inhibition enhances contrast and decorrelates similar patterns of activity. (a) Left, schematic of network connectivity of the computational model indicating all-to-all connectivity. Each neuron showed the same type of activity-dependent gating of lateral inhibition as observed in our results (compare right panel of Fig. 6a to Fig. 2d or 1d, activity in Fig. 6a shown in arbitrary units). Two types of activity-dependent inhibition were compared (solid line, full return to baseline activity; dotted line, 50% return to baseline activity). (b) Example of a simulated olfactory-response pattern before (left) and after (right, color map rescaled) processing by activity-dependent lateral inhibition. (c) Correlation matrix of 16 different olfactory-response patterns of simulated mitral-cell activity before (left) and after (right) activity-dependent lateral inhibition. (d,e) Average activity and correlation across all maps for activity-dependent lateral inhibition and other models of inhibition. The initially high correlation (open arrow, 0.33; thick lines, time at which the left panels of b and c were derived) was substantially decreased by activity-dependent lateral inhibition (closed arrow, 0.11; time at which second panels of b and c were derived; scale bar, 0.05 correlation units per arbitrary time units), but not for networks with subtractive or divisive inhibition (thin lines). (f) Digital image before (left) and after (right) processing with the network model of activity-dependent lateral inhibition.

Similar articles

Cited by

References

    1. Hirsch JA, Gilbert CD. Synaptic physiology of horizontal connections in the cat's visual cortex. J Neurosci. 1991;11:1800–1809. - PMC - PubMed
    1. Urban NN. Lateral inhibition in the olfactory bulb and in olfaction. Physiol Behav. 2002;77:607–612. - PubMed
    1. Friedrich RW, Laurent G. Dynamic optimization of odor representations by slow temporal patterning of mitral cell activity. Science. 2001;291:889–894. - PubMed
    1. Linster C, Sachse S, Galizia CG. Computational modeling suggests that response properties rather than spatial position determine connectivity between olfactory glomeruli. J Neurophysiol. 2005;93:3410–3417. - PubMed
    1. Kuffler SW. Discharge patterns and functional organization of mammalian retina. J Neurophysiol. 1953;16:37–68. - PubMed

Publication types