. 2008 Jan;11(1):88-94.
doi: 10.1038/nn2029. Epub 2007 Dec 16.

On and off domains of geniculate afferents in cat primary visual cortex

Affiliations

On and off domains of geniculate afferents in cat primary visual cortex

Jianzhong Z Jin et al. Nat Neurosci. 2008 Jan.

Abstract

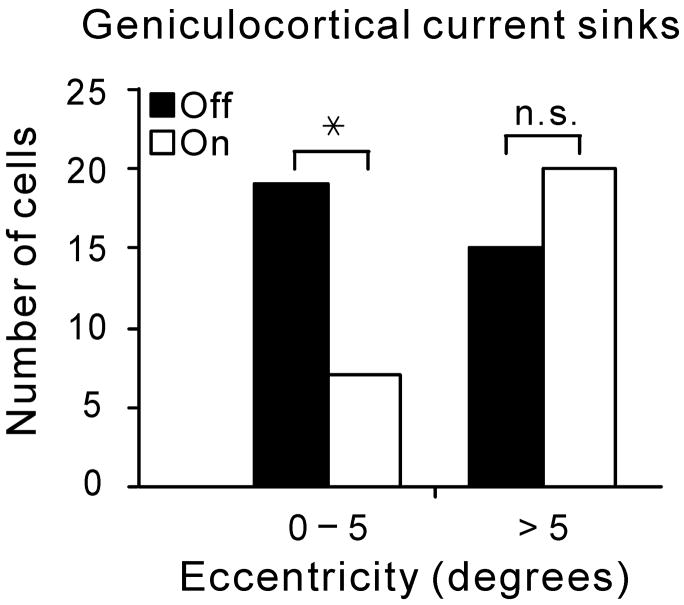
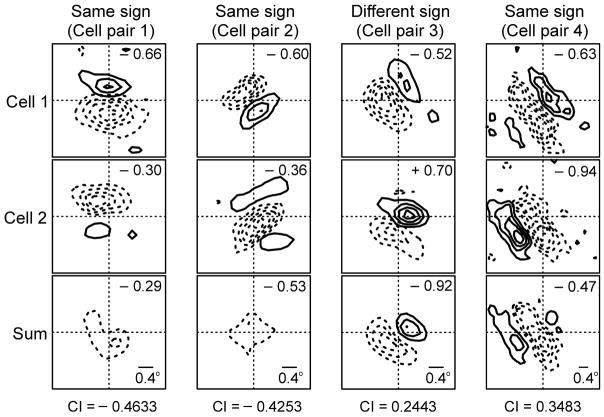
On- and off-center geniculate afferents form two major channels of visual processing that are thought to converge in the primary visual cortex. However, humans with severely reduced on responses can have normal visual acuity when tested in a white background, which indicates that off channels can function relatively independently from on channels under certain conditions. Consistent with this functional independence of channels, we demonstrate here that on- and off-center geniculate afferents segregate in different domains of the cat primary visual cortex and that off responses dominate the cortical representation of the area centralis. On average, 70% of the geniculate afferents converging at the same cortical domain had receptive fields of the same contrast polarity. Moreover, off-center afferents dominated the representation of the area centralis in the cortex, but not in the thalamus, indicating that on- and off-center afferents are balanced in number, but not in the amount of cortical territory that they cover.


Figures

Figure 1
Figure 1. Recording from geniculate afferents in the muscimol-silenced cortex
a. Cortical recordings showing a radial alignment of a single electrode penetration within a cortical orientation domain, determined before application of muscimol. Cortical layers reconstructed from histology are indicated by Roman numerals I-VI (WM: white matter). The preferred orientations of cortical neurons recorded along the course of the electrode penetration are indicated by lines. Muscimol was applied to the surface of the cortex to silence cortical activity, and after two hours, afferent receptive fields were plotted in layer IV between the two letter Ls, which show centers of lesions made at the end of the experiment. b. Four representative vertical penetrations through layer 4, two dominated by off-center afferents (A, B), one dominated by on-center afferents (D) and another one mixed (C). c. Table showing all electrode penetrations, the number of afferents recorded in each (left) and the category assigned to each penetration. d. Map showing the segregation of on- and off-center afferents obtained in two different experiments by making multiple single-electrode penetrations. Left, actual maps, luminance-coded by the fraction of off afferents. Right, identical maps smoothed by a 2-D Gaussian in order to highlight the clustering of penetrations of like type.
Figure 2
Figure 2. Recording from geniculate afferents in active cortex
a. Simultaneous recordings from single cells in LGN and local field potentials in the visual cortex. Well-isolated spikes from a single geniculate cell were used as triggers to obtain spike-triggered field potentials for each cortical channel. The time of the geniculate spike is indicated by the vertical dashed lines in the depth profiles shown in (a) and (b). The second spatial derivative of these field potentials, which is directly proportional to the current density at a point, was estimated by current-source-density analysis. The result from this spike-triggered current-source-density (STCSD) analysis is shown through the depth of the cortex as individual traces and a colorized image. b. Example of two geniculate cells that generated current sinks at the same cortical domain and had overlapping receptive fields of the same sign. The cell on the left was of Y type and the one on the right of X type. As expected from previous anatomical studies , the Y cell had faster conduction velocity and projected higher within layer 4 than the X cell. c. 70% of the geniculate cell pairs converging at the same cortical domain had receptive fields of the same sign (n = 37, P = 0.014, Chi-square test). The frequency of cell pairs with receptive fields of the same sign is shown as a function of receptive field overlap for all cell pairs (left), cell pairs of the same type (right top), and cell pairs of different type (right bottom).
Figure 3
Figure 3. Off-center geniculate cells dominate the representation of the area centralis in cat visual cortex
a Near the cortical representation of the area centralis (< 5 degrees eccentricity), current sinks generated by off-center geniculate afferents were more frequently found than current sinks generated by on-center geniculate afferents (P = 0.02, Chi-square test, data obtained from 9 cats). This difference was not found outside of the area centralis. b. Recordings from LGN demonstrate that on- and off-center geniculate cells are balanced in number at two different eccentricity ranges. Significance was assessed with a Chi-square test (n.s.: not significant; *: P = 0.018).
Figure 4
Figure 4. Most cortical simple cells are off-dominated within the cortical representation of the area centralis
a Examples from four pairs of neighboring simple cells (each cell pair was recorded from the same electrode). Each column shows the receptive fields for each cell (top and middle panels) and the receptive field sum at the bottom. The top left corner of each panel provides a subregion-strength ratio calculated as sign*non-dominant response/dominant response, where the sign is −1 when the dominant subregion is off and 1 when the dominant subregion is on (notice that most cells in this example have negative ratios, which correspond to off-dominant subregions). The correlation index at the bottom of the column was calculated by cross-correlating the two spatial receptive fields. b. Top. Cell pairs with off-dominated receptive fields were more frequently found that cell pairs with on-dominated receptive fields (p = 0.004, Chi-square test). Bottom. Correlation indices from all pairs of simple cells studied.
Figure 5
Figure 5. Off-center geniculate afferents cover more cortical territory than on-center geniculate afferents
a Cortical territory covered by a single X geniculate afferent estimated as the number of synapses [blue, taken from 29] and as the strength of the single-afferent current sink measured in multiple penetrations with a 16-channel silicon probe (red). The colorized inset shows the depth profile of the single-afferent current sink measured in one of the penetrations. b. Maximum distance covered by single X and Y geniculate afferents, estimated from the anatomical reconstruction of single afferents (blue, taken from 29) and from measurements of single-afferent current sinks (red). Error bars show one standard deviation. Notice that the average Y/X distance ratio obtained with the two measurements was similar (anatomy: 1.4, physiology: 1.6), however, the measurements of current sinks are more restricted in cortical distance probably because the density of synaptic boutons is very low at the periphery of the axonal arbors and because some current sinks may have been under sampled (due to the limited number of penetrations used to measure horizontal distance). c. The current sinks generated by off-center geniculate afferents can be recorded at larger cortical distances than the current sinks generated by on-center geniculate afferents (P = 0.03, Mann-Whitney test, n = 19). The sample contains 8 off-center geniculate afferents (3 X, 4 Y and 1 non-classified cell) and 11 on-center geniculate afferents (6 X, 4 Y and 1 non-classified cell).

Similar articles

Cited by

References

    1. Chichilnisky EJ, Kalmar RS. Functional asymmetries in ON and OFF ganglion cells of primate retina. J Neurosci. 2002;22:2737–2747. - PMC - PubMed
    1. Renteria RC, et al. J Neurosci. 2006;26:11857–11869. - PMC - PubMed
    1. Peichl L. Alpha and delta ganglion cells in the rat retina. J Comp Neurol. 1989;286:120–139. - PubMed
    1. Peichl L, Ott H, Boycott BB. Alpha ganglion cells in mammalian retinae. Proc R Soc Lond B Biol Sci. 1987;231:169–197. - PubMed
    1. Dacey DM, Petersen MR. Dendritic field size and morphology of midget and parasol ganglion cells of the human retina. Proc Natl Acad Sci U S A. 1992;89:9666–9670. - PMC - PubMed

Publication types