

doi: 10.1038/nmeth1147.
Epub 2007 Dec 16.
Integrating spatially resolved three-dimensional MALDI IMS with in vivo magnetic resonance imaging
Affiliations
- PMID: 18084298
- PMCID: PMC2649801
- DOI: 10.1038/nmeth1147
Item in Clipboard
Integrating spatially resolved three-dimensional MALDI IMS with in vivo magnetic resonance imaging
Nat Methods.
2008 Jan.
Abstract
We have developed a method for integrating three dimensional-volume reconstructions of spatially resolved matrix-assisted laser desorption/ionization imaging mass spectrometry (MALDI IMS) ion images of whole mouse heads with high-resolution images from other modalities in an animal-specific manner. This approach enabled us to analyze proteomic profiles from MALDI IMS data with corresponding in vivo data provided by magnetic resonance imaging.
Figures
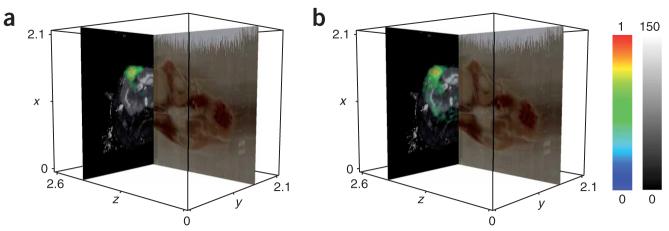
Coregistered MALDI IMS and magnetic resonance data from a whole mouse head. (a) The red-green-blue image plane shows a sagittal section from the optical blockface volume. The axial magnetic resonance image represents the quantitative transverse relaxation (T2) component of the tissue, rendered in grayscale on a scale of 0 (black) to 150 ms (white). The MALDI IMS data for Pea15 are volume rendered as the yellow and green cloud. (b) The same rendering as in a is shown for Fabp5. Each axis is measured in centimeters and the white outline represents the extent of the blockface volume. The MALDI IMS data are rendered in color representing arbitrary units of intensity with from 0 (blue) to 1 (red).
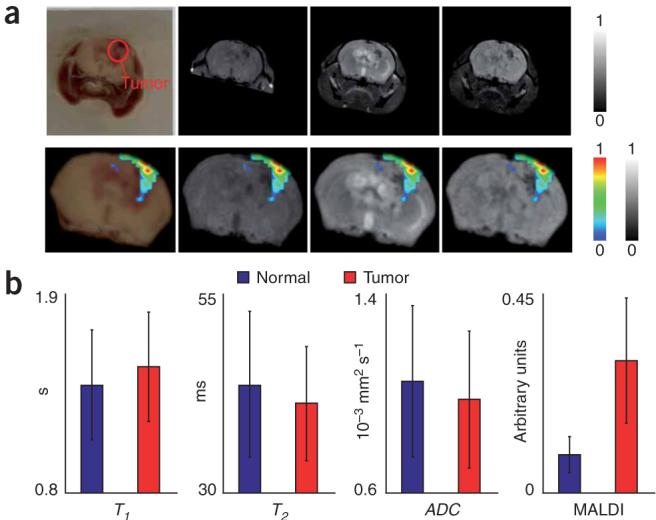
Intermodal validation of the MALDI IMS signature for Pea15, a biomarker for grade III glioma. (a) Coregistered MALDI IMS and magnetic resonance data from a whole mouse head. Top, corresponding slices from coregistered blockface, T1w’, T2w and diffusion weighted volumes, rendered in normalized grayscale (0 is black, 1 is white). Bottom, the same slice from each modality with the MALDI-IMS protein distribution overlaid. The ranges for all of the imaging data were normalized to 1 with corresponding red-green-blue and grayscale color bars shown. (b) Results of ROI analysis for manually selected ROIs that corresponded to normal and tumor tissue. Representative ROIs in a from a single slice are shown in the blockface image in a.
Similar articles
-
Exploring three-dimensional matrix-assisted laser desorption/ionization imaging mass spectrometry data: three-dimensional spatial segmentation of mouse kidney.Anal Chem. 2012 Jul 17;84(14):6079-87. doi: 10.1021/ac300673y. Epub 2012 Jul 5. Anal Chem. 2012. PMID: 22720760
-
Co-registration of multi-modality imaging allows for comprehensive analysis of tumor-induced bone disease.Bone. 2014 Apr;61:208-16. doi: 10.1016/j.bone.2014.01.017. Epub 2014 Jan 30. Bone. 2014. PMID: 24487126 Free PMC article.
-
Monitoring the inflammatory response to infection through the integration of MALDI IMS and MRI.Cell Host Microbe. 2012 Jun 14;11(6):664-73. doi: 10.1016/j.chom.2012.04.018. Cell Host Microbe. 2012. PMID: 22704626 Free PMC article.
-
Imaging mass spectrometry for lipidomics.Biochim Biophys Acta. 2011 Nov;1811(11):961-9. doi: 10.1016/j.bbalip.2011.03.004. Epub 2011 Mar 29. Biochim Biophys Acta. 2011. PMID: 21440085 Review.
-
Matrix-assisted laser desorption/ionization imaging mass spectrometry.Int J Mol Sci. 2010;11(12):5040-55. doi: 10.3390/ijms11125040. Epub 2010 Dec 7. Int J Mol Sci. 2010. PMID: 21614190 Free PMC article. Review.
Cited by
-
Mass spectrometry imaging for biomedical applications.Anal Bioanal Chem. 2013 Jul;405(17):5645-53. doi: 10.1007/s00216-013-6916-z. Epub 2013 Mar 29. Anal Bioanal Chem. 2013. PMID: 23539099 Free PMC article.
-
Mass spectrometry imaging under ambient conditions.Mass Spectrom Rev. 2013 May-Jun;32(3):218-43. doi: 10.1002/mas.21360. Epub 2012 Sep 20. Mass Spectrom Rev. 2013. PMID: 22996621 Free PMC article. Review.
-
Imaging Infection Across Scales of Size: From Whole Animals to Single Molecules.Annu Rev Microbiol. 2021 Oct 8;75:407-426. doi: 10.1146/annurev-micro-041521-121457. Epub 2021 Aug 3. Annu Rev Microbiol. 2021. PMID: 34343016 Free PMC article. Review.
-
Connecting structure and function from organisms to molecules in small-animal symbioses through chemo-histo-tomography.Proc Natl Acad Sci U S A. 2021 Jul 6;118(27):e2023773118. doi: 10.1073/pnas.2023773118. Proc Natl Acad Sci U S A. 2021. PMID: 34183413 Free PMC article.
-
Integrative Multiscale Biochemical Mapping of the Brain via Deep-Learning-Enhanced High-Throughput Mass Spectrometry.bioRxiv [Preprint]. 2023 Nov 18:2023.05.31.543144. doi: 10.1101/2023.05.31.543144. bioRxiv. 2023. Update in: Nat Methods. 2024 Mar;21(3):521-530. doi: 10.1038/s41592-024-02171-3. PMID: 37398021 Free PMC article. Updated. Preprint.
References
Publication types
MeSH terms
Substances
Grants and funding
LinkOut - more resources
Full Text Sources
Other Literature Sources
Medical
