

Array painting reveals a high frequency of balanced translocations in breast cancer cell lines that break in cancer-relevant genes
- PMID: 18084325
- PMCID: PMC2423006
- DOI: 10.1038/sj.onc.1210993
Array painting reveals a high frequency of balanced translocations in breast cancer cell lines that break in cancer-relevant genes
Abstract
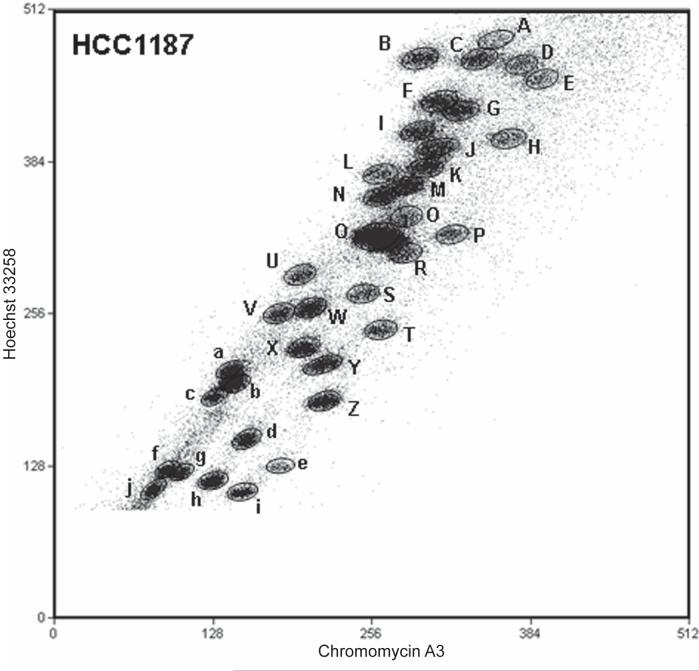
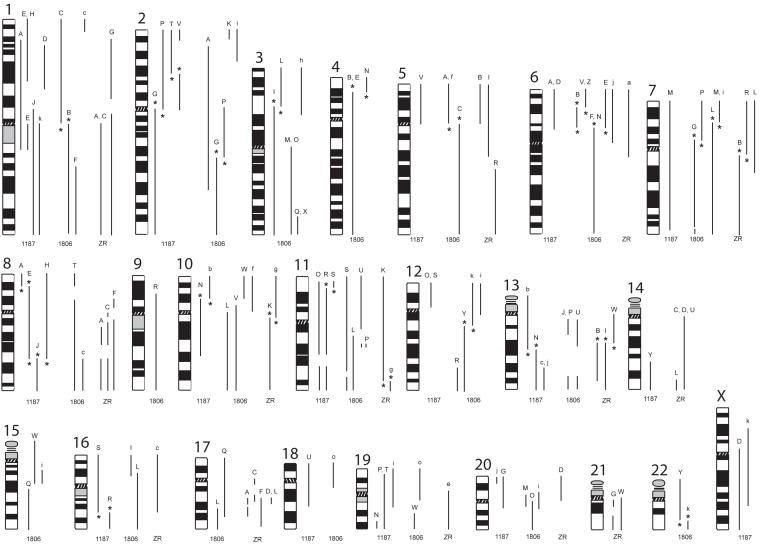
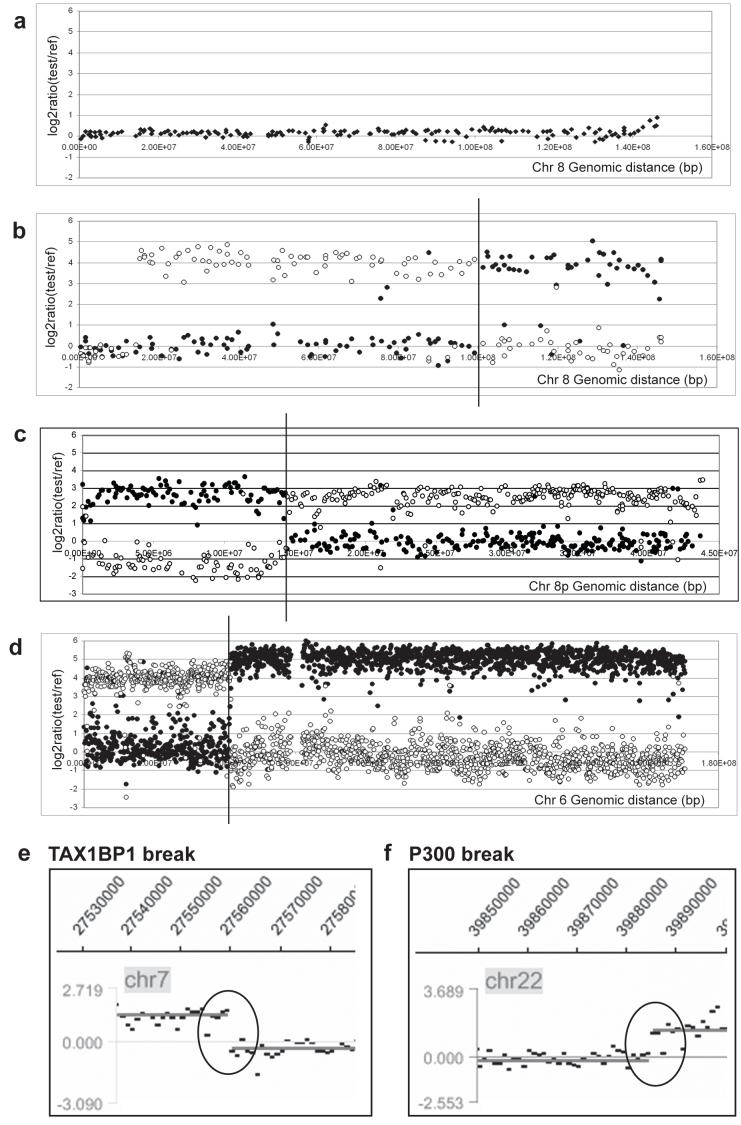
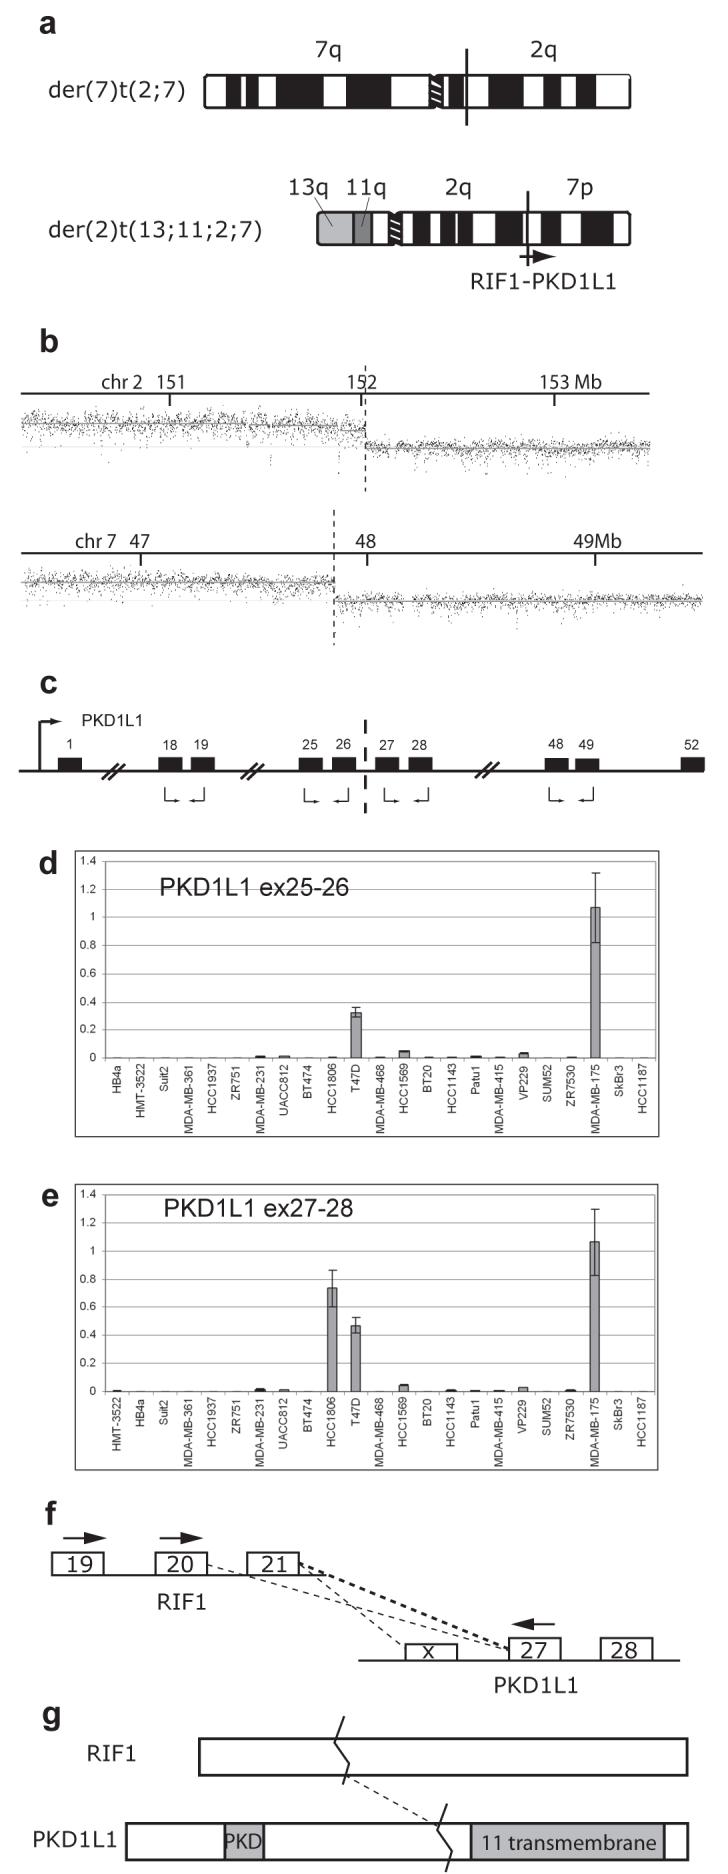
Chromosome translocations in the common epithelial cancers are abundant, yet little is known about them. They have been thought to be almost all unbalanced and therefore dismissed as mostly mediating tumour suppressor loss. We present a comprehensive analysis by array painting of the chromosome translocations of breast cancer cell lines HCC1806, HCC1187 and ZR-75-30. In array painting, chromosomes are isolated by flow cytometry, amplified and hybridized to DNA microarrays. A total of 200 breakpoints were identified and all were mapped to 1 Mb resolution on bacterial artificial chromosome (BAC) arrays, then 40 selected breakpoints, including all balanced breakpoints, were further mapped on tiling-path BAC arrays or to around 2 kb resolution using oligonucleotide arrays. Many more of the translocations were balanced at 1 Mb resolution than expected, either reciprocal (eight in total) or balanced for at least one participating chromosome (19 paired breakpoints). Second, many of the breakpoints were at genes that are plausible targets of oncogenic translocation, including balanced breaks at CTCF, EP300/p300 and FOXP4. Two gene fusions were demonstrated, TAX1BP1-AHCY and RIF1-PKD1L1. Our results support the idea that chromosome rearrangements may play an important role in common epithelial cancers such as breast cancer.
Figures
Similar articles
-
Ultra-high resolution array painting facilitates breakpoint sequencing.J Med Genet. 2007 Jan;44(1):51-8. doi: 10.1136/jmg.2006.044909. Epub 2006 Sep 13. J Med Genet. 2007. PMID: 16971479 Free PMC article.
-
Cytogenetically balanced translocations are associated with focal copy number alterations.Hum Genet. 2007 Feb;120(6):795-805. doi: 10.1007/s00439-006-0251-9. Epub 2006 Oct 19. Hum Genet. 2007. PMID: 17051368
-
Large duplications at reciprocal translocation breakpoints that might be the counterpart of large deletions and could arise from stalled replication bubbles.Genome Res. 2011 Apr;21(4):525-34. doi: 10.1101/gr.114116.110. Epub 2011 Jan 20. Genome Res. 2011. PMID: 21252201 Free PMC article.
-
Historical and Clinical Perspectives on Chromosomal Translocations.Adv Exp Med Biol. 2018;1044:1-14. doi: 10.1007/978-981-13-0593-1_1. Adv Exp Med Biol. 2018. PMID: 29956287 Review.
-
Characterising chromosome rearrangements: recent technical advances in molecular cytogenetics.Heredity (Edinb). 2012 Jan;108(1):75-85. doi: 10.1038/hdy.2011.100. Epub 2011 Nov 16. Heredity (Edinb). 2012. PMID: 22086080 Free PMC article. Review.
Cited by
-
RIF1 Links Replication Timing with Fork Reactivation and DNA Double-Strand Break Repair.Int J Mol Sci. 2021 Oct 23;22(21):11440. doi: 10.3390/ijms222111440. Int J Mol Sci. 2021. PMID: 34768871 Free PMC article. Review.
-
High-resolution array CGH clarifies events occurring on 8p in carcinogenesis.BMC Cancer. 2008 Oct 7;8:288. doi: 10.1186/1471-2407-8-288. BMC Cancer. 2008. PMID: 18840272 Free PMC article.
-
Single-molecule analysis of genome rearrangements in cancer.Nucleic Acids Res. 2011 Jul;39(13):e85. doi: 10.1093/nar/gkr227. Epub 2011 Apr 27. Nucleic Acids Res. 2011. PMID: 21525129 Free PMC article.
-
RVD2: an ultra-sensitive variant detection model for low-depth heterogeneous next-generation sequencing data.Bioinformatics. 2015 Sep 1;31(17):2785-93. doi: 10.1093/bioinformatics/btv275. Epub 2015 Apr 29. Bioinformatics. 2015. PMID: 25931517 Free PMC article.
-
Replication Stress, Genomic Instability, and Replication Timing: A Complex Relationship.Int J Mol Sci. 2021 Apr 30;22(9):4764. doi: 10.3390/ijms22094764. Int J Mol Sci. 2021. PMID: 33946274 Free PMC article. Review.
References
-
- Adeyinka A, Kytola S, Mertens F, Pandis N, Larsson C. Spectral karyotyping and chromosome banding studies of primary breast carcinomas and their lymph node metastases. Int J Mol Med. 2000;5:235–40. - PubMed
-
- Alsop AE, Teschendorff AE, Edwards PA. Distribution of breakpoints on chromosome 18 in breast, colorectal, and pancreatic carcinoma cell lines. Cancer Genet Cytogenet. 2006;164:97–109. - PubMed
-
- Barlund M, Monni O, Weaver JD, Kauraniemi P, Sauter G, Heiskanen M, Kallioniemi OP, Kallioniemi A. Cloning of BCAS3 (17q23) and BCAS4 (20q13) genes that undergo amplification, overexpression, and fusion in breast cancer. Genes Chromosomes Cancer. 2002;35:311–7. - PubMed
-
- Briand P, Petersen OW, Van Deurs B. A new diploid nontumorigenic human breast epithelial cell line isolated and propagated in chemically defined medium. In Vitro Cell Dev Biol. 1987;23:181–8. - PubMed
Publication types
MeSH terms
Substances
Grants and funding
LinkOut - more resources
Full Text Sources
Other Literature Sources
Medical
Miscellaneous
