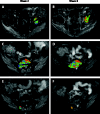
A feasibility study evaluating the functional diffusion map as a predictive imaging biomarker for detection of treatment response in a patient with metastatic prostate cancer to the bone
- PMID: 18084607
- PMCID: PMC2134897
- DOI: 10.1593/neo.07954
A feasibility study evaluating the functional diffusion map as a predictive imaging biomarker for detection of treatment response in a patient with metastatic prostate cancer to the bone
Abstract
Prostate cancer (PCa) is the most commonly diagnosed cancer in American men with a subset inevitably presenting with metastatic disease to the bone. A well-recognized limitation in evaluating new treatments for metastatic PCa is the inability to use imaging to objectively assess response therapy. In this study, we evaluated the feasibility of clinically translating the functional diffusion map (fDM) imaging biomarker for quantifying the spatiotemporal effects of bone tumor response in a patient treated for metastatic PCa with bone metastases. A patient beginning therapy was scanned using MRI before treatment and again at 2 and 8 weeks post-treatment initiation to quantify changes in tumor diffusion values. Three metastatic lesions were identified for fDM analysis, all of which all demonstrated an early increase in diffusion values at 2 weeks, which increased further at 8 weeks post-treatment initiation. This finding correlated with a decrease in the patient's prostate-specific antigen (PSA) levels suggestive of patient response. CT, bone scans, and anatomic MRI images obtained posttreatment were found to be uninformative for the assessment of treatment effectiveness. This study presents the feasibility of fDM-measurements in osseous lesions over time and shows that changes in fDM values were consistent with therapeutic response. Thus, the fDM imaging biomarker may provide a quantifiable therapeutic endpoint to assess response in patients with metastatic bone cancer.
Keywords: Metastatic prostate cancer; androgen deprivation therapy; diffusion MRI; functional diffusion map; imaging biomarker.
Figures


References
-
- American Cancer Society, author. Cancer Facts & Figures 2007. Atlanta: American Cancer Society; 2007.
-
- Petrylak DP, Tangen CM, Hussain MH, Lara PN, Jr, Jones JA, Taplin ME, Burch PA, Berry D, Moinpour C, Kohli M. Docetaxel and estramustine compared with mitoxantrone and prednisone for advanced refractory prostate cancer. N Engl J Med. 2004;351(15):1513–1520. - PubMed
-
- Tannock IF, de Wit R, Berry WR, Horti J, Pluzanska A, Chi KN, Oudard S, Theodore C, James ND, Turesson I. Docetaxel plus prednisone or mitoxantrone plus prednisone for advanced prostate cancer. N Engl J Med. 2004;351(15):1502–1512. - PubMed
Publication types
MeSH terms
Substances
Grants and funding
- T32CA009357/CA/NCI NIH HHS/United States
- P01 CA087634/CA/NCI NIH HHS/United States
- P01CA87634/CA/NCI NIH HHS/United States
- T32 GM145304/GM/NIGMS NIH HHS/United States
- P50CA93990/CA/NCI NIH HHS/United States
- T32 CA009357/CA/NCI NIH HHS/United States
- P01 CA085878/CA/NCI NIH HHS/United States
- P50 CA069568/CA/NCI NIH HHS/United States
- P01CA85878/CA/NCI NIH HHS/United States
- P50CA69568/CA/NCI NIH HHS/United States
- P01CA093900/CA/NCI NIH HHS/United States
- P50 CA093990/CA/NCI NIH HHS/United States
- P01 CA093900/CA/NCI NIH HHS/United States
LinkOut - more resources
Full Text Sources
Other Literature Sources
Medical
Research Materials
Miscellaneous
