. 2007 Dec;9(12):1021-9.
doi: 10.1593/neo.07787.

In vivo molecular imaging to diagnose and subtype tumors through receptor-targeted optically labeled monoclonal antibodies

Affiliations

In vivo molecular imaging to diagnose and subtype tumors through receptor-targeted optically labeled monoclonal antibodies

Yoshinori Koyama et al. Neoplasia. 2007 Dec.

Abstract

Molecular imaging of cell surface receptors can potentially diagnose tumors based on their distinct expression profiles. Using multifilter spectrally resolved optical imaging with three fluorescently labeled antibodies, we simultaneously imaged three different cell surface receptors to distinguish tumor types noninvasively. We selected tumors overexpressing different subtypes of EGFR receptor: HER-1 (A431) and HER-2 (NIH3T3/HER2(+)), or interleukin-2 receptor alpha-subunit receptor (IL-2Ralpha; SP2/Tac). After tumor establishment, a cocktail of three fluorescently labeled monoclonal antibodies was injected: cetuximab-Cy5 (targetingHER-1), trastuzumab-Cy7(HER-2),anddaclizumab-AlexaFluor-700 (IL-2Ra). Optical fluorescence imaging was performed after 24 hours with both a red filter set and three successive filter sets (yellow, red, and deep red). Spectrally resolved imaging of 10 mice clearly distinguished A431, NIH3T3/HER2(+), and SP2-Tac tumors based on their distinct optical spectra. Three-filter sets significantly increased the signal-to-background ratio compared to a single-filter set by reducing the background signal, thus significantly improving the differentiation of each of the receptors targeted (P < .022). In conclusion, following multifilter spectrally resolved imaging, different tumor types can be simultaneously distinguished and diagnosed in vivo. Multiple filter sets increase the signal-to-noise ratio by substantially reducing the background signal, and may allow more optical dyes to be resolved within the narrow limits of the near-infrared spectrum.

Keywords: Growth factor receptor; antibody cocktail; contrast agent; near-infrared; optical imaging.


Figures

Figure 1
Figure 1
Schematic representation of the multiple-filter acquisition technique. The optical dyes Cy5, AlexaFluor700, and Cy7 have peak emissions of 694, 719, and 776 nm, respectively. Three filter sets (yellow, red, and deep red) were used to acquire a single image cube over these wavelengths. For the yellow light filter, a band-pass filter from 575 to 605 nm (590/30) and a longpass filter of 645 nm were used for excitation and emission light, respectively. For the red filter set, these values were 615 to 665 (640/50) and 700 nm, respectively; for the deep red filter set, the values were 671 to 705 (688/34) and 750 nm, respectively.
Figure 2
Figure 2
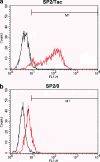
FACS flow cytometry: Results for (A) SP2/Tac and (B) SP2/0 cell lines 72 hours after incubation with antibody linked to a fluorescent dye. (A) About 2 µg/ml daclizumab (antibody to IL-2Rα receptor) linked to Rhodamine Green, shows strong binding affinity to IL-2Rα-overexpressing SP2/Tac cells. (B) SP2/0 cells (negative control, not expressing IL-2Rα receptors) show only minimal, nonspecific binding of the daclizumab-Rhodamine Green.
Figure 3
Figure 3
Fluorescence microscopy studies. (A and B) The amounts 1 x 10⁴ SP2/Tac cells and (C and D) 1 x 10⁴ SP2/0 cells incubated with daclizumab-Rhodamine Green (RhodG) and viewed under fluorescence filter after 1, 4, 8, 24, 48, and 72 hours of incubation. In each case, differential interference contrast images are shown in the left column and fluorescent light images in the right column. SP2/Tac cells start to show binding of daclizumab-RhodG to the IL-2Rα receptors expressed on their cell surface as early as 1 hour postincubation. With time, the complexes are gradually internalized into the cell with gradual perinuclear localization. Control SP2/0 cells (which do not express the IL-2Rα receptor) do not show uptake of daclizumab-RhodG at any of the time points. Experiments were performed on an Olympus BX61 microscope (magnification, x 20) using a 2-second exposure.
Figure 4
Figure 4
Multitumor in vivo spectral fluorescence imaging. Unmixed in vivo optical imaging following acquisition by (A) a single (red) filter or by (B) three (yellow, red, and deep red) filters in the same mouse. Bold arrow, A431 tumors; arrowhead, NIH3T3/HER2+ tumors; curved arrow, SP2/Tac tumors; clear arrow, LS174T tumors. Columns left to right demonstrate composite, Cy5 spectral, AlexaFluor700 spectral, and Cy7 spectral images, respectively. Cy5 spectral image shows strong uptake of cetuximab-Cy5 by A431 tumors, AlexaFluor700 spectra shows high uptake by SP2/Tac tumors, and Cy7 spectral image shows increased uptake of trastuzumab-Cy7 by NIH3T3/HER2+ tumors. The composite image (unmixing) allows differentiation of the tumors: red, A431; green, NIH3T3/HER2+; blue, SP2/Tac. Multifilter acquisition and unmixing more clearly differentiates the tumor type, significantly increasing the signal-to-background ratios by reducing the signal derived from autofluorescence and the blood pool effect (background).
Figure 5
Figure 5
Unmixed ex vivo optical imaging following acquisition by (A) a single (red) filter or by (B) three (yellow, red, and deep red) filters in the same mouse. Bold arrow, A431 tumors; arrowhead, NIH3T3/HER2+ tumors; curved arrow, SP2/Tac tumors; clear arrow, LS174T tumors. Columns left to right demonstrate white light, AlexaFluor700, composite, Cy5, Cy7 spectral images, and composite images, respectively. As with in vivo imaging, the composite image (unmixing) allows differentiation of the tumors: red, A431; green, NIH3T3/HER2+; blue, SP2/Tac. Unmixing following both single- and multifilter acquisition produces similar results, implying that multifilter acquisition is most useful in reducing the background (noise) signal.

References

    1. Hoffman RM. The multiple uses of fluorescent proteins to visualize cancer in vivo. Nat Rev Cancer. 2005;5:796–806. - PubMed
    1. Barrett T, Koyama Y, Hama Y, Ravizzini G, Shin IS, Jang B-S, Paik CH, Choyke PL, Kobayashi H. Molecular imaging for typing epidermal growth factor receptors expressed on tumor cells using a cocktail of two monoclonal antibodies conjugated with two distinct near infrared fluorophores. Clin Cancer Res. 2007 - PubMed
    1. Cohen BD, Siegall CB, Bacus S, Foy L, Green JM, Hellstrom I, Hellstrom KE, Fell HP. Role of epidermal growth factor receptor family members in growth and differentiation of breast carcinoma. Biochem Soc Symp. 1998;63:199–210. - PubMed
    1. Souder C, Leitzel K, Ali SM, Demers L, Evans DB, Chaudri-Ross HA, Hackl W, Hamer P, Carney W, Lipton A. Serum epidermal growth factor receptor/HER-2 predicts poor survival in patients with metastatic breast cancer. Cancer. 2006;107:2337–2345. - PubMed
    1. Carrington C. Optical imaging sheds light on cancer's signature-regional blood flow and tissue oxygenization measures may permit earlier breast cancer detection. Diagn Imaging. 2004. June: http://www.diagnostic imaging.com/molecularimagingoutlook/2004jun/

Publication types

MeSH terms

LinkOut - more resources