

The contribution of transactivation subdomains 1 and 2 to p53-induced gene expression is heterogeneous but not subdomain-specific
- PMID: 18084613
- PMCID: PMC2134902
- DOI: 10.1593/neo.07688
The contribution of transactivation subdomains 1 and 2 to p53-induced gene expression is heterogeneous but not subdomain-specific
Abstract
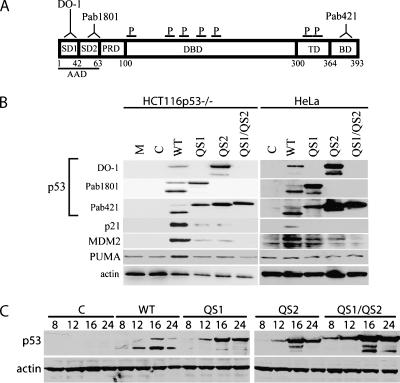
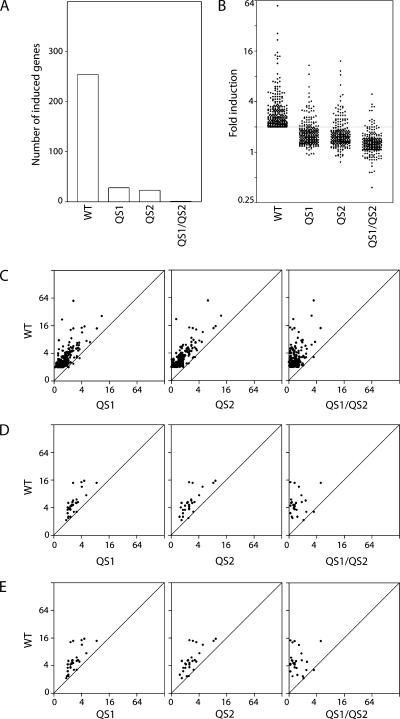
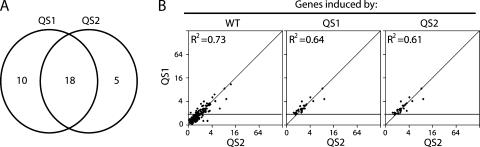
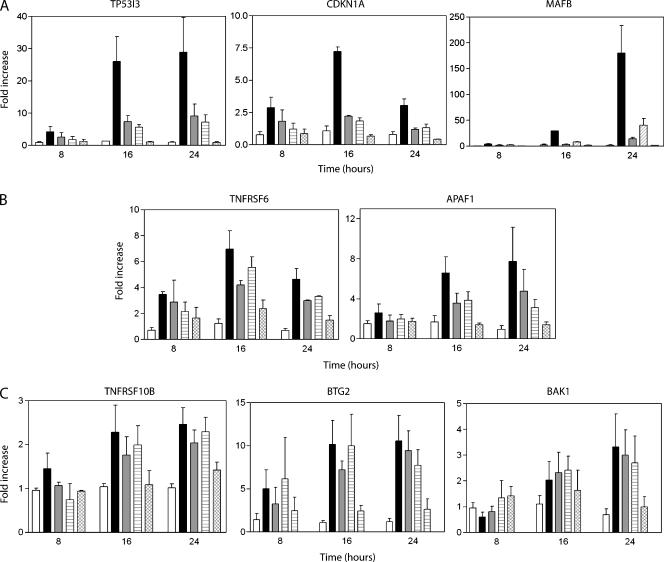
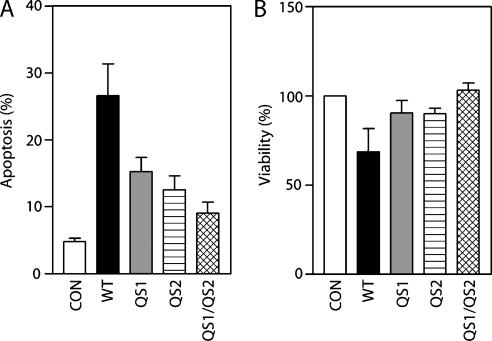
Two adjacent regions within the transactivation domain of p53 are sufficient to support sequence-specific transactivation when fused to a heterologous DNA binding domain. It has been hypothesized that these two subdomains of p53 may contribute to the expression of distinct p53-responsive genes. Here we have used oligonucleotide microarrays to identify transcripts induced by variants of p53 with point mutations within subdomains 1, 2, or 1 and 2 (QS1, QS2, and QS1/QS2, respectively). The expression of 254 transcripts was increased in response to wild-type p53 expression but most of these transcripts were poorly induced by these variants of p53. Strikingly, a number of known p53-regulated transcripts including TNFRSF10B, BAX, BTG2, and POLH were increased to wild-type levels by p53(QS1) and p53(QS2) but not p53(QS1/QS2), indicating that either subdomain 1 or 2 is sufficient for p53-dependent expression of a small subset of p53-responsive genes. Unexpectedly, there was no evidence for p53(QS1)- or p53(QS2)-specific gene expression. Taken together, we found heterogeneity in the requirement for transactivation subdomains 1 and 2 of p53 without any subdomain-specific contribution to p53-induced gene expression.
Keywords: apoptosis; gene expression; microarray; p53; transcription factor.
Figures
Similar articles
-
Definition of a p53 transactivation function-deficient mutant and characterization of two independent p53 transactivation subdomains.Oncogene. 1999 Apr 8;18(14):2405-10. doi: 10.1038/sj.onc.1202539. Oncogene. 1999. PMID: 10327062
-
Novel human p53 mutations that are toxic to yeast can enhance transactivation of specific promoters and reactivate tumor p53 mutants.Oncogene. 2001 Jun 7;20(26):3409-19. doi: 10.1038/sj.onc.1204457. Oncogene. 2001. PMID: 11423991
-
Tumor-derived p53 mutants induce oncogenesis by transactivating growth-promoting genes.Oncogene. 2004 May 27;23(25):4430-43. doi: 10.1038/sj.onc.1207553. Oncogene. 2004. PMID: 15077194
-
P53-responsive genes and the potential for cancer diagnostics and therapeutics development.Biotechnol Annu Rev. 2001;7:131-64. doi: 10.1016/s1387-2656(01)07035-1. Biotechnol Annu Rev. 2001. PMID: 11686042 Review.
-
Transactivation of repair genes by BRCA1.Cancer Biol Ther. 2002 Sep-Oct;1(5):490-1. doi: 10.4161/cbt.1.5.162. Cancer Biol Ther. 2002. PMID: 12496474 Review.
Cited by
-
A conserved amphipathic helix in the N-terminal regulatory region of the papillomavirus E1 helicase is required for efficient viral DNA replication.J Virol. 2011 Jun;85(11):5287-300. doi: 10.1128/JVI.01829-10. Epub 2011 Mar 30. J Virol. 2011. PMID: 21450828 Free PMC article.
-
NF-κB-dependent role for cold-inducible RNA binding protein in regulating interleukin 1β.PLoS One. 2013;8(2):e57426. doi: 10.1371/journal.pone.0057426. Epub 2013 Feb 21. PLoS One. 2013. PMID: 23437386 Free PMC article.
-
The War on Cancer rages on.Neoplasia. 2009 Dec;11(12):1252-63. doi: 10.1593/neo.91866. Neoplasia. 2009. PMID: 20019833 Free PMC article.
-
Neoplasia: the second decade.Neoplasia. 2008 Dec;10(12):1314-24. doi: 10.1593/neo.81372. Neoplasia. 2008. PMID: 19048110 Free PMC article.
-
The role of mRNA decay in p53-induced gene expression.RNA. 2011 Dec;17(12):2222-34. doi: 10.1261/rna.030122.111. Epub 2011 Oct 21. RNA. 2011. PMID: 22020975 Free PMC article.
References
-
- Harris SL, Levine AJ. The p53 pathway: positive and negative feedback loops. Oncogene. 2005;24:2899–2908. - PubMed
-
- Iwakuma T, Lozano G, Flores ER. Li-Fraumeni syndrome: a p53 family affair. Cell Cycle. 2005;4:865–867. - PubMed
-
- Donehower LA, Harvey M, Slagle BL, McArthur MJ, Montgomery CA, Jr, Butel JS, Bradley A. Mice deficient for p53 are developmentally normal but susceptible to spontaneous tumours. Nature. 1992;356:215–221. - PubMed
-
- Ahn J, Prives C. The C-terminus of p53: the more you learn the less you know. Nat Struct Biol. 2001;8:730–732. - PubMed
-
- Candau R, Scolnick DM, Darpino P, Ying CY, Halazonetis TD, Berger SL. Two tandem and independent sub-activation domains in the amino terminus of p53 require the adaptor complex for activity. Oncogene. 1997;15:807–816. - PubMed
Publication types
MeSH terms
Substances
LinkOut - more resources
Full Text Sources
Research Materials
Miscellaneous