

Tracking the migration of dendritic cells by in vivo optical imaging
- PMID: 18084620
- PMCID: PMC2134909
- DOI: 10.1593/neo.07586
Tracking the migration of dendritic cells by in vivo optical imaging
Abstract
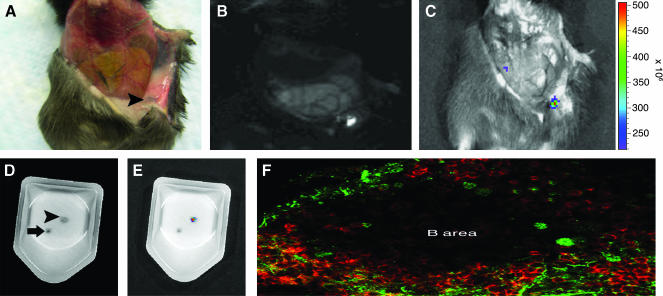
We report herein a method to track the migration of dendritic cells (DCs) using optical imaging. With the assistance of the delivery module, fluorescein isothiocyanate (FITC) could internalize inside DCs within 15 minutes of incubation. The fluorescent signal was mostly cytoplasmic and could be detected using in vivo imaging. Furthermore, we observed that the probe did not interfere with the DCs maturation as we assessed the expression of several surface markers. The labeled DCs secreted interleukin-12 (IL-12) and tumor necrosis factor-alpha (TNF-alpha) and stimulated the proliferation of CD4+ T lymphocytes responding to lipopolysaccharide (LPS) stimulation. We have systematically compared the probe uptake between mature and immature DCs. The study showed that the latter phagocytosed the probe slightly better than the former. Intravital imaging of treated mice showed the migration of DCs to lymph nodes (LNs), which is confirmed by immunohistochemistry. Taken together, we demonstrated the potential use of optical imaging for tracking the migration of DCs and homing in vivo. The delivery molecules could also be used on other imaging modalities or for delivery of antigens.
Keywords: Dendritic cells; antigen-presenting cells.; delivery; lymph node; optical imaging.
Figures


Similar articles
-
The migration of synthetic magnetic nanoparticle labeled dendritic cells into lymph nodes with optical imaging.Int J Nanomedicine. 2013;8:3737-44. doi: 10.2147/IJN.S52135. Epub 2013 Oct 7. Int J Nanomedicine. 2013. PMID: 24124362 Free PMC article.
-
Cytokine production by mouse myeloid dendritic cells in relation to differentiation and terminal maturation induced by lipopolysaccharide or CD40 ligation.Blood. 2001 Sep 1;98(5):1512-23. doi: 10.1182/blood.v98.5.1512. Blood. 2001. PMID: 11520802
-
Triptolide, a constituent of immunosuppressive Chinese herbal medicine, is a potent suppressor of dendritic-cell maturation and trafficking.Blood. 2005 Oct 1;106(7):2409-16. doi: 10.1182/blood-2005-03-0854. Epub 2005 Jun 14. Blood. 2005. PMID: 15956285 Free PMC article.
-
Noninvasive imaging of dendritic cell migration into lymph nodes using near-infrared fluorescent semiconductor nanocrystals.FASEB J. 2008 Nov;22(11):3908-18. doi: 10.1096/fj.08-112896. Epub 2008 Aug 5. FASEB J. 2008. PMID: 18682573
-
Role of c-Jun N-terminal kinase on lipopolysaccharide induced maturation of human monocyte-derived dendritic cells.Int Immunol. 2004 Dec;16(12):1701-9. doi: 10.1093/intimm/dxh171. Epub 2004 Oct 11. Int Immunol. 2004. PMID: 15477228
Cited by
-
NEAR-INFRARED DYES: Probe Development and Applications in Optical Molecular Imaging.Curr Org Synth. 2011 Aug;8(4):521-534. doi: 10.2174/157017911796117223. Curr Org Synth. 2011. PMID: 21822405 Free PMC article.
-
Molecular imaging of bacterial infections in vivo: the discrimination of infection from inflammation.Informatics (MDPI). 2014 May 30;1(1):72-99. doi: 10.3390/informatics1010072. Informatics (MDPI). 2014. PMID: 26985401 Free PMC article.
-
Cell Tracking in Cancer Immunotherapy.Front Med (Lausanne). 2020 Feb 14;7:34. doi: 10.3389/fmed.2020.00034. eCollection 2020. Front Med (Lausanne). 2020. PMID: 32118018 Free PMC article. Review.
-
Targeted delivery of amikacin into granuloma.Am J Respir Crit Care Med. 2010 Dec 15;182(12):1546-53. doi: 10.1164/rccm.200912-1888OC. Epub 2010 Aug 6. Am J Respir Crit Care Med. 2010. PMID: 20693382 Free PMC article.
-
Lipo-oligoarginines as effective delivery vectors to promote cellular uptake.Mol Biosyst. 2010 Oct;6(10):2049-55. doi: 10.1039/c004684a. Epub 2010 Aug 9. Mol Biosyst. 2010. PMID: 20694264 Free PMC article.
References
-
- Mohty M, Olive D, Gaugler B. Leukemic dendritic cells: potential for therapy and insights towards immune escape by leukemic blasts. Leukemia. 2002;16(11):2197–2204. - PubMed
-
- Dermime S, Armstrong A, Hawkins RE, Stern PL. Cancer vaccines and immunotherapy. Br Med Bull. 2002;62:149–162. - PubMed
-
- Nieland JD, Da Silva DM, Velders MP, de Visser KE, Schiller JT, Muller M, Kast WM. Chimeric papillomavirus virus-like particles induce a murine self-antigen-specific protective and therapeutic antitumor immune response. J Cell Biochem. 1999;73(2):145–152. - PubMed
Publication types
MeSH terms
Substances
Grants and funding
LinkOut - more resources
Full Text Sources
Research Materials