. 2007 Dec;9(12):1138-51.
doi: 10.1593/neo.07568.

Hypoxia and the presence of human vascular endothelial cells affect prostate cancer cell invasion and metabolism

Affiliations

Hypoxia and the presence of human vascular endothelial cells affect prostate cancer cell invasion and metabolism

Ellen Ackerstaff et al. Neoplasia. 2007 Dec.

Abstract

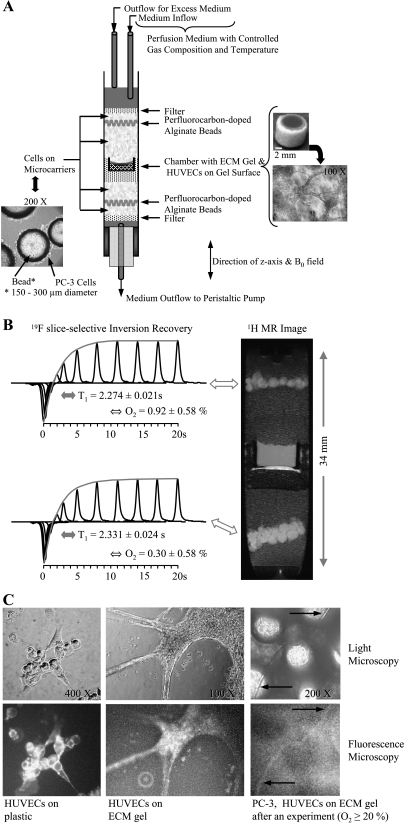
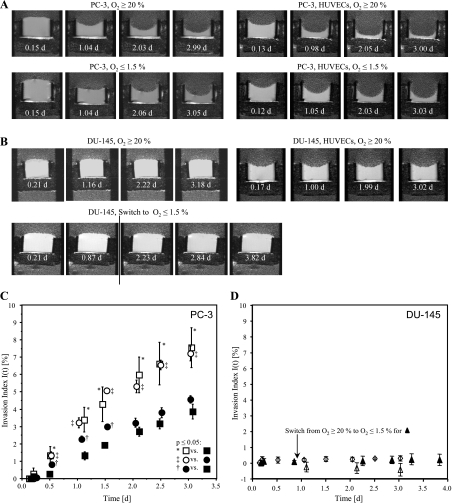
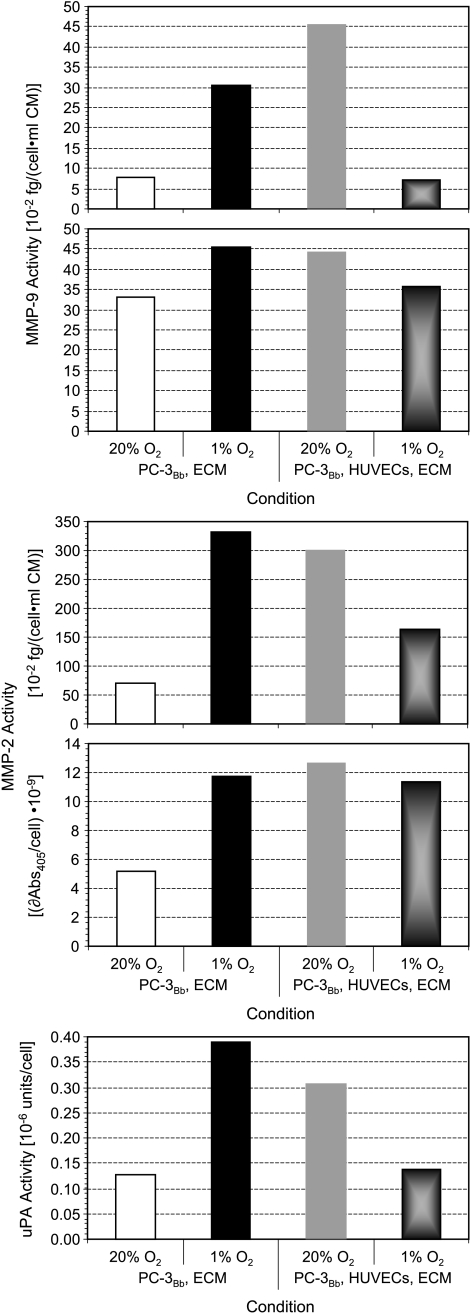
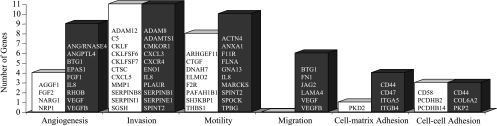
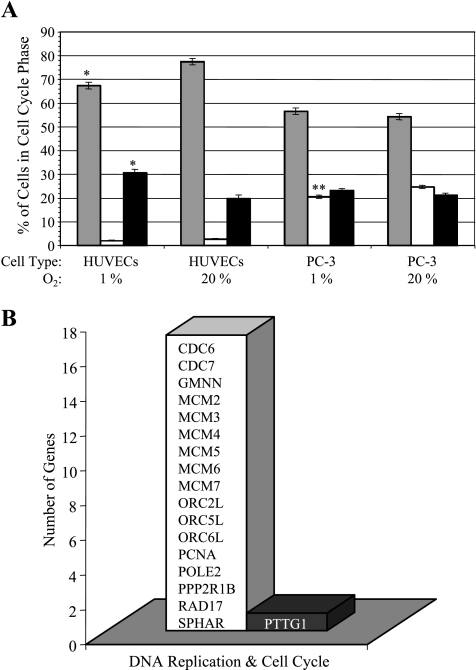
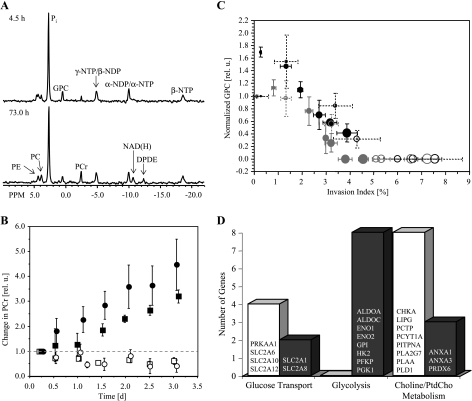
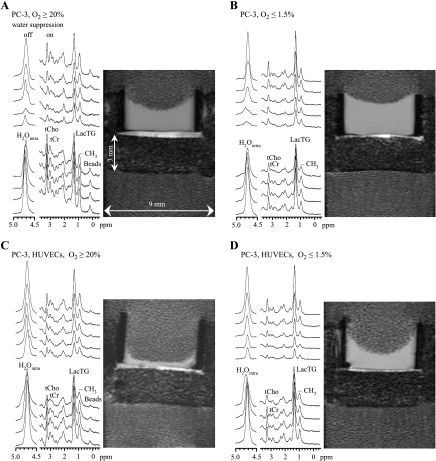
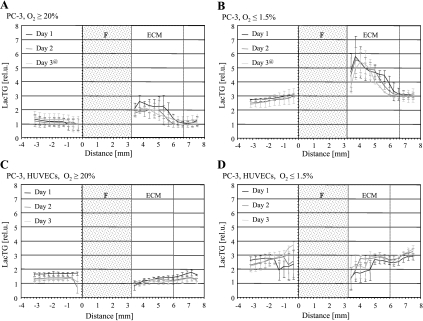
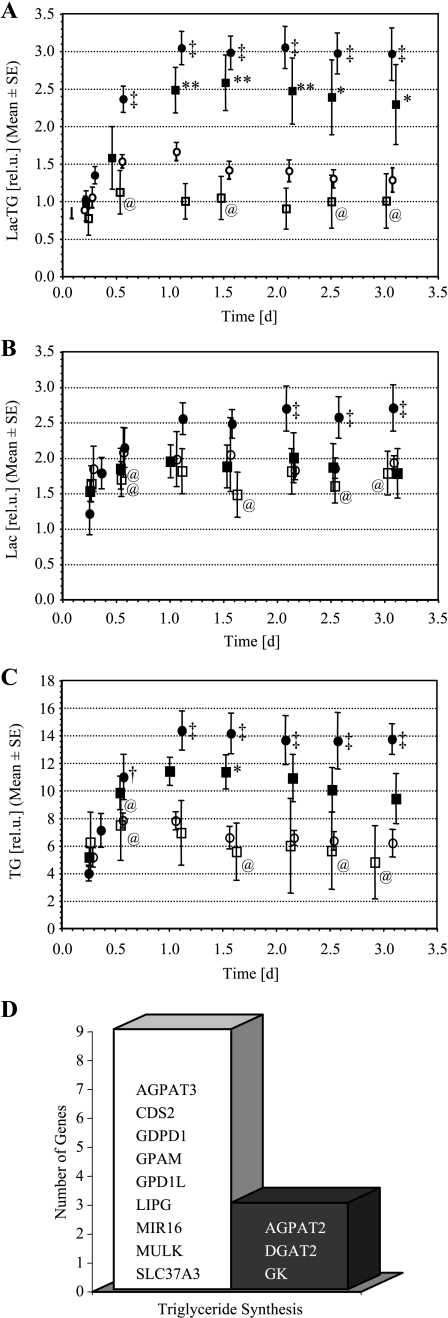
Tumor progression and metastasis are influenced by hypoxia, as well as by interactions between cancer cells and components of the stroma, such as endothelial cells. Here, we have used a magnetic resonance (MR)-compatible invasion assay to further understand the effects of hypoxia on human prostate cancer cell invasion and metabolism in the presence and absence of human umbilical vein endothelial cells (HUVECs). Additionally, we compared endogenous activities of selected proteases related to invasion in PC-3 cells and HUVECs, profiled gene expression of PC-3 cells by microarray, and evaluated cell proliferation of PC-3 cells and HUVECs by flow cytometry, under hypoxic and oxygenated conditions. The invasion of less-invasive DU-145 cells was not affected by either hypoxia or the presence of HUVECs. However, hypoxia significantly decreased the invasion of PC-3 cells. This hypoxia-induced decrease was attenuated by the presence of HUVECs, whereas under oxygenated conditions, HUVECs did not alter the invasion of PC-3 cells. Cell metabolism changed distinctly with hypoxia and invasion. The endogenous activity of selected extracellular proteases, although altered by hypoxia, did not fully explain the hypoxia-induced changes in invasion. Gene expression profiling indicated that hypoxia affects multiple cellular functions and pathways.

Keywords: Prostate cancer; endothelial/cancer cell interaction; hypoxia; invasion; magnetic resonance (MR) imaging and spectroscopy.


Figures

Figure 1
Figure 1
(A) Photomicrograph of PC-3 cells grown adherently on microcarriers (left) and schematic display of the sample structure (center). On the right are photomicrographs of the invasion chamber filled with ECM gel (top) and an example of the distribution of HUVECs on the ECM gel at the start of an experiment (bottom). (B) Oxygen tension measurement in the MBC. Reprinted with permission from Pathak et al. [18]. (C, left to right) Representative phase contrast light micrographs (upper panel) and wide-field fluorescence images (lower panel) obtained after fluorescent anti-CD31 mouse monoclonal antibody staining of HUVECs on tissue culture plastic (1:50 dilution) (left), on ECM gel (1:50 dilution) (center), and at the end of an MR experiment (1:10 dilution, 20-minute incubation time) (right). The control experiments revealed specific staining of HUVECs (C, left), but neither the PC-3 cells (data not shown) nor the ECM gel was stained (C, center). Despite the higher background fluorescence due to the autofluorescence of Biosilon beads, a capillary-like structure staining positively for CD31 was identified in images taken at the end of a 3-day experiment with the MBC (C, right, arrows), confirming the presence of viable HUVECs. Wide-field fluorescence and corresponding phase contrast micrographs were captured on an inverted microscope (ECLIPSE TS100) equipped with a digital camera (Coolpix 990; Nikon Corporation, Tokyo, Japan). An excitation bandwidth of 450 to 490 nm and an emission bandwidth of 500 to 550 nm were used for fluorescence imaging.
Figure 2
Figure 2
(A, B) Representative 1H MR images of PC-3 cells alone, PC-3 cells combined with HUVECs, under oxygenated or hypoxic conditions, hypoxic and oxygenated DU-145 cells, and oxygenated DU-145 cells in the presence of HUVECs. The 1H MR images demonstrate differences in degradation of ECM gel by PC-3 under the different conditions (A) but show no visible degradation of the ECM gel by DU-145 cells (B). In experiments with HUVECs, 20 µl less volume of ECM was loaded in the chamber to accommodate the suspension of HUVECs on the surface of the polymerized ECM gel resulting in a concave surface of the ECM gel at the start of the experiments. The resulting differences in the thickness of the ECM gel at the start of the experiments were accounted for in the calculation of the invasion index I(t). (C) Invasion index I(t) versus time for (□) oxygenated PC-3 cells (n = 4); (○) PC-3 cells in the presence of HUVECs under oxygenated conditions (n = 4); (■) PC-3 cells alone under hypoxia (n = 4); (●) PC-3 cells in the presence of HUVECs under hypoxia (n = 4). (D) Invasion index I(t) over time for (△) oxygenated DU-145 (n = 4), (▴) DU-145 exposed to continuous hypoxia starting day 1 (n = 2), and (⋄) oxygenated DU-145 in the presence of HUVECs (n = 3). (C, D) Values represent mean ± SEM. The Mann-Whitney U test was performed to test for statistically significant differences (P < .05).
Figure 3
Figure 3
Endogenous enzyme activities of MMP-9, MMP-2, and uPA for oxygenated and hypoxic PC-3 cells grown adherently on Biosilon beads (PC-3Bb) in the absence and presence of HUVECs on the surface of the ECM gel. Whenever the concentration standard resulted in a usable standard curve, concentrations were calculated otherwise the results were reported as absorbance at 405 nm per cell (δAbs405/cell) which is proportional to the enzyme activity per cell. A summary and additional data for the different conditions can be found in Table W1 and Figure W1. Each panel represents an independent experiment.
Figure 4
Figure 4
Genes related to adhesion, motility, migration, invasion, and angiogenesis that have been downregulated (open bar) and upregulated (closed bar) as a result of 48-hour hypoxic (1.0 ± 0.2% O2) exposure of PC-3 cells in tissue culture compared to oxygenated control cells (20% O2) (n = 2).
Figure 5
Figure 5
(A) Percentage of cells in G0/G1 phase (gray bar), in S phase (white bar), and in G2/M phase (black bar) under oxygenated compared to hypoxic conditions (*P ≤ .1, **P ≤ .05). Values represent adjusted means ± SEM from three independent experiments. (B) Genes related to DNA replication in the cell cycle that have been downregulated (open bar) and upregulated (closed bar) as a result of 48-hour hypoxic (1.0 ± 0.2% O2) exposure of PC-3 cells in tissue culture compared to oxygenated control cells (20% O2) (n = 2).
Figure 6
Figure 6
(A) Representative 31P MR spectra obtained from PC-3 cells maintained under hypoxia. These spectra were obtained at 4.5 and 73 hours of hypoxia, and demonstrated the stability of energy metabolism and pH. Metabolites assigned are: PE, phosphoethanolamine; PC, phosphocholine; Pi, inorganic phosphate; GPC, glycerophosphocholine; PCr, phosphocreatine; NTP/NDP, nucleoside triphosphate/nucleoside diphosphate; NAD(H), composed of NAD+, NADH, NADP+, and NADPH; DPDE, diphosphodiester. (B) Relative changes of PCr over time for (□) PC-3 cells alone under oxygenated conditions (n = 4); (○) PC-3 cells in the presence of HUVECs under oxygenated conditions (n = 4); (■) PC-3 cells alone under hypoxia (n = 4); (●) PC-3 cells in the presence of HUVECs under hypoxia (n = 4). Values represent mean ± SEM. (C) Correlation between the changes in GPC levels and the invasion index I(t) for (○) oxygenated PC-3 cells, (●) hypoxic PC-3 cells, (○) PC-3 cells combined with HUVECs under oxygenated conditions, and (●) PC-3 cells combined with HUVECs under hypoxia. The diameter of the open or closed circles is directly proportional to the time. Values represent mean ± SEM obtained of four independent experiments. (D) Genes related to glucose transport, the glycolytic pathway, and phosphatidylcholine metabolism that have been downregulated (open bar) and upregulated (closed bar) as a of 48-hour hypoxic (1.0 ± 0.2% O2) exposure of PC-3 cells in tissue culture compared to oxygenated PC-3 cells (20% O2) (n = 2).
Figure 7
Figure 7
Representative 1D 1H CSI spectra of 310-µm-thick slices (every third spectrum is shown) obtained along the sample at 47 hours, acquired with or without water suppression, together with the corresponding 1H MR images for (A) oxygenated PC-3 cells, (B) hypoxic PC-3 cells, (C) PC-3 cells in the presence of HUVECs under oxygenated conditions, and (D) PC-3 cells in the presence of HUVECs under hypoxia.
Figure 8
Figure 8
Relative levels of lactate and triglycerides (LacTG) along the sample obtained for (A) oxygenated PC-3 cells, (B) hypoxic PC-3 cells, (C) PC-3 cells in the presence of HUVECs under oxygenated conditions, and (D) PC-3 cells in the presence of HUVECs under hypoxia. Values, presented as mean ± SEM, are from localized 1D 1H MR spectra averaged over four experiments for each condition, unless for time points marked with an at sign (@), which were averaged over three independent MR experiments. The base of the ECM gel chamber was defined as 0 mm. F represents the thickness of filter material forming the base of the ECM gel chamber; ECM, the thickness of ECM gel at the start of the MR experiments.
Figure 9
Figure 9
Intracellular (A) LacTG, (B) Lac, and (C) TG, calculated from global 1D 1H MR spectra. Note that the relative scale in (A) acquired with a stimulated echo acquisition mode-based pulse sequence differs from (B) and (C), which were acquired with a lactate-edited SE-based pulse sequence. (□) PC-3 cells alone under oxygenated conditions (n = 4); (○) PC-3 cells in the presence of HUVECs under oxygenated conditions (n = 4); (■) PC-3 cells alone under hypoxia (n = 4); (●) PC-3 cells in the presence of HUVECs under hypoxia (n = 4). Values represent mean ± SEM. At sign (@), time points at which values of only three independent experiments were available. **P < .05, *P < .1, □ versus ■; P < .05, P < .1, ○ versus ● (Mann-Whitney U Test). (D) Genes related to triglyceride synthesis that have been downregulated (open bar) and upregulated (closed bar) as a result of 48-hour hypoxic (1.0 ± 0.2% O2) exposure of PC-3 cells in tissue culture compared to oxygenated control cells (20% O2) (n = 2).

Similar articles

Cited by

References

    1. Bissell MJ, Radisky D. Putting tumours in context. Nat Rev Cancer. 2001;1:46–54. - PMC - PubMed
    1. Liotta LA, Kohn EC. The microenvironment of the tumour-host interface. Nature. 2001;411:375–379. - PubMed
    1. Cairns RA, Khokha R, Hill RP. Molecular mechanisms of tumor invasion and metastasis: an integrated view. Curr Mol Med. 2003;3:659–671. - PubMed
    1. Subarsky P, Hill RP. The hypoxic tumour microenvironment and metastatic progression. Clin Exp Metastasis. 2003;20:237–250. - PubMed
    1. Friedl P, Brocker EB. The biology of cell locomotion within three-dimensional extracellular matrix. Cell Mol Life Sci. 2000;57:41–64. - PMC - PubMed

Publication types

MeSH terms

LinkOut - more resources