. 2007 Apr;311(1):429-435.
doi: 10.1016/j.jmmm.2006.10.1148.

Use of a SQUID array to detect T-cells with magnetic nanoparticles in determining transplant rejection

Affiliations

Use of a SQUID array to detect T-cells with magnetic nanoparticles in determining transplant rejection

Edward R Flynn et al. J Magn Magn Mater. 2007 Apr.

Abstract

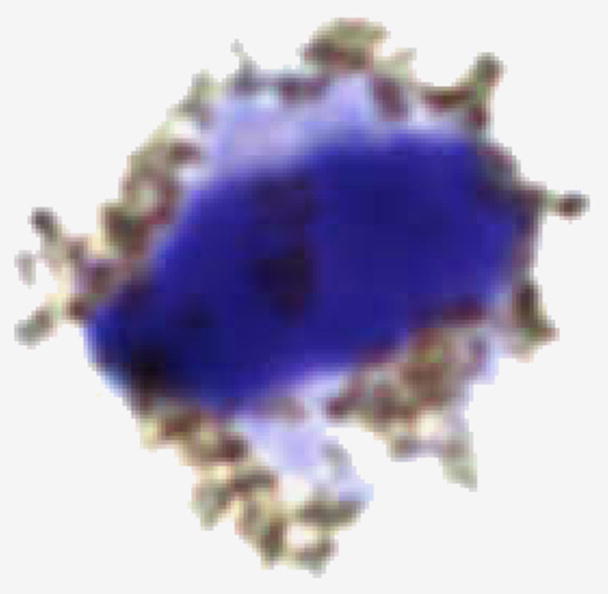
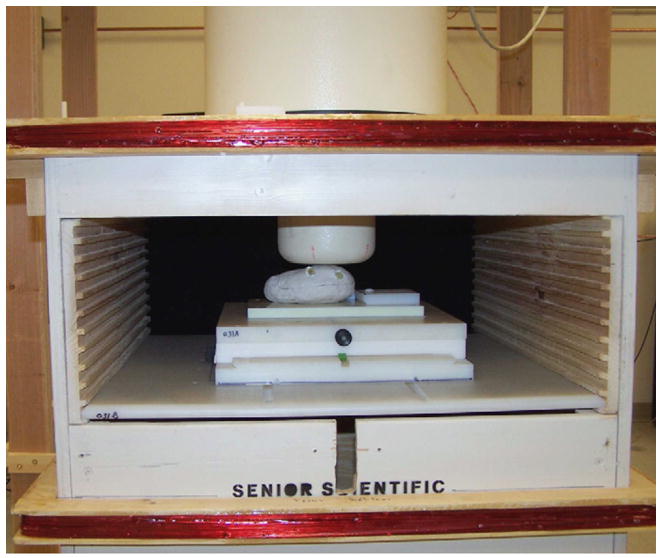
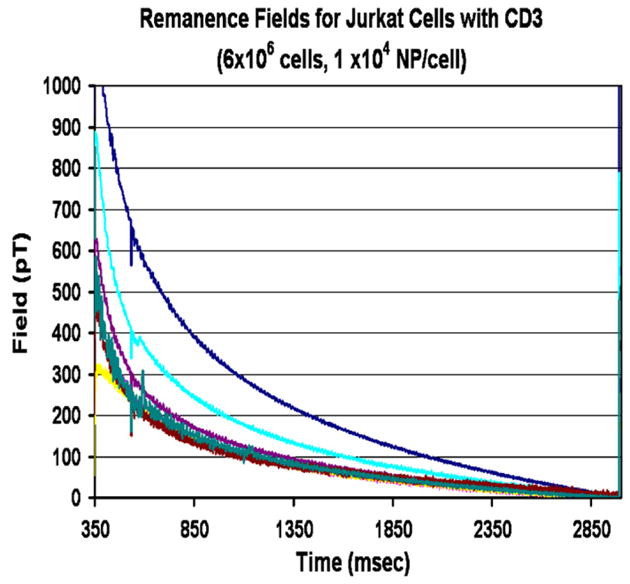
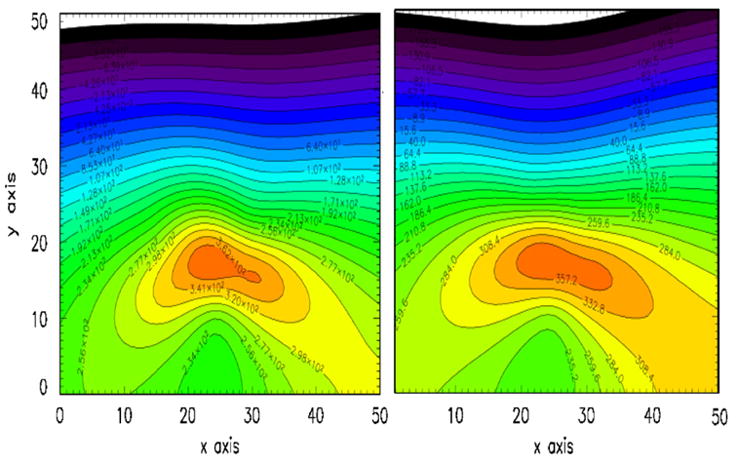
Acute rejection in organ transplant is signaled by the proliferation of T-cells that target and kill the donor cells requiring painful biopsies to detect rejection onset. An alternative non-invasive technique is proposed using a multi-channel superconducting quantum interference device (SQUID) magnetometer to detect T-cell lymphocytes in the transplanted organ labeled with magnetic nanoparticles conjugated to antibodies specifically attached to lymphocytic ligand receptors. After a magnetic field pulse, the T-cells produce a decaying magnetic signal with a characteristic time of the order of a second. The extreme sensitivity of this technique, 10(5) cells, can provide early warning of impending transplant rejection and monitor immune-suppressive chemotherapy.


Figures

Fig. 1
Fig. 1
A microscopic photo (20,000 × ), of a live T-cell as used in these measurements. Attached to this cell by CD2 antibodies are approximately 10,000 magnetite nanoparticles of 25 nm diameter with a carboxyl coating.
Fig. 2
Fig. 2
Photo of measurement platform showing SQUID sensors, magnetizing coils, moveable stage and full sized kidney containing two nanoparticle sources of live cells in vials.
Fig. 3
Fig. 3
Decaying remanence field as seen in all 7-channel SQUID channels from a source of nanoparticles coupled to Jurkat Cells conjugated with CD3 antibodies.
Fig. 4
Fig. 4
Contour lines of the fields produced by two sources of nanoparticles. On the right are the field contours from the two sources of live cells shown in Fig. 2 and Table 1. On the left are theoretical contour fields from two dipole sources that have been allowed to vary in position and amplitude until a least-squared fit to the data were obtained. The resulting coordinates and source strengths are given in Table 2.
Fig. 5
Fig. 5
Values of χ2 fits to nanoparticle sources as a function of x and y, left figure, and z, the right figure. These were obtained by varying the theoretical forward calculation coordinates and obtaining the χ2 values as a function of these coordinates. Standard error analysis were then used to obtain the χ2 values.

Similar articles

Cited by

References

    1. Merion RM, et al. JAMA. 2005;294:2726. - PubMed
    1. Parhan P. Elsevier Ltd; New York/London: 2001.
    1. Bentley GA, Mariuzza RA. Annu Rev Immunol. 1996;14:563. - PubMed
    1. McDevitt HO. Annu Rev Immunol. 2000;18:1. - PubMed
    1. Flynn ER, Bryant HC. Phys Med Biol. 2005;50:1273. - PMC - PubMed

LinkOut - more resources