

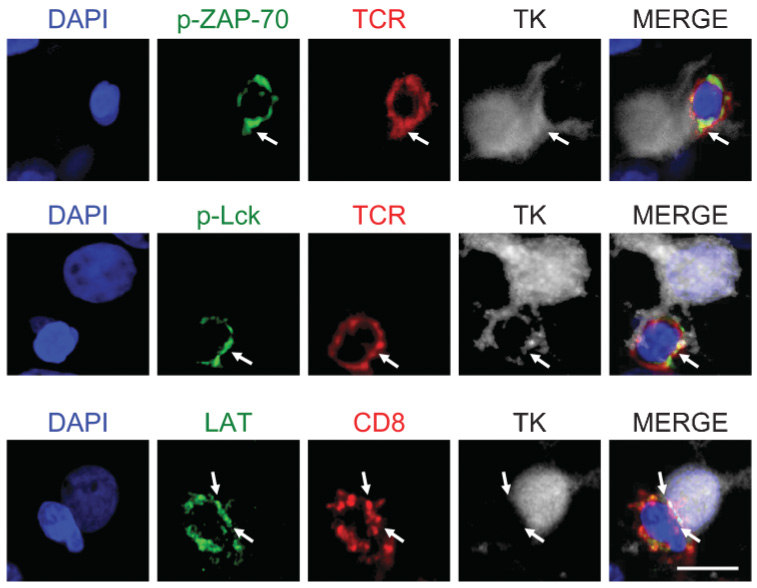
Immunological thresholds in neurological gene therapy: highly efficient elimination of transduced cells might be related to the specific formation of immunological synapses between T cells and virus-infected brain cells
- PMID: 18084640
- PMCID: PMC2139984
- DOI: 10.1017/S1740925X07000579
Immunological thresholds in neurological gene therapy: highly efficient elimination of transduced cells might be related to the specific formation of immunological synapses between T cells and virus-infected brain cells
Abstract
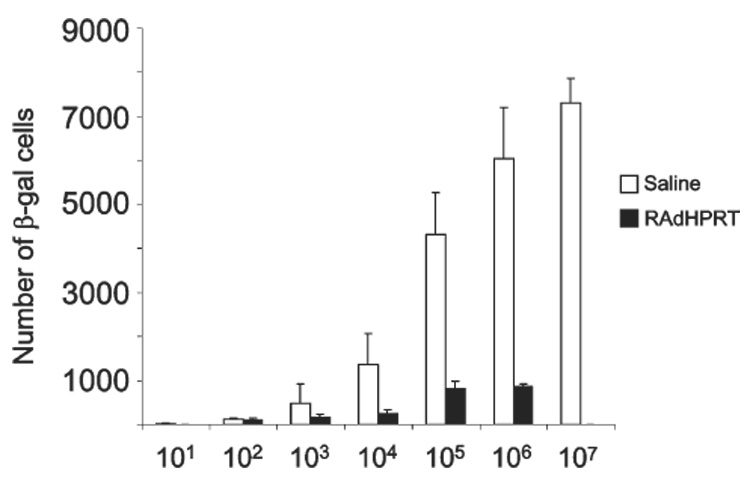
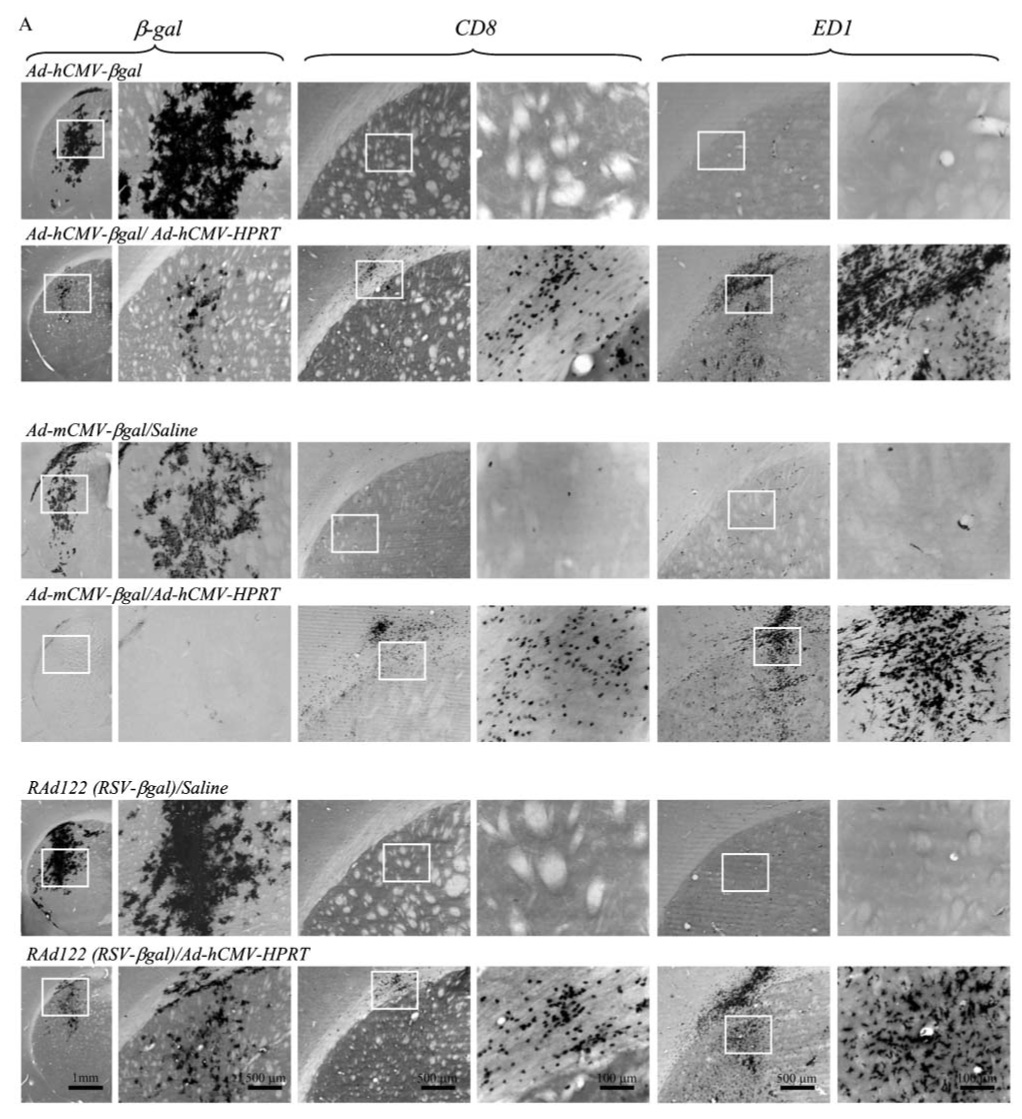
First-generation adenovirus can be engineered with powerful promoters to drive expression of therapeutic transgenes. Numerous clinical trials for glioblastoma multiforme using first generation adenoviral vectors have either been performed or are ongoing, including an ongoing, Phase III, multicenter trial in Europe and Israel (Ark Therapeutics, Inc.). Although in the absence of anti-adenovirus immune responses expression in the brain lasts 6-18 months, systemic infection with adenovirus induces immune responses that inhibit dramatically therapeutic transgene expression from first generation adenoviral vectors, thus, potentially compromising therapeutic efficacy. Here, we show evidence of an immunization threshold for the dose that generates an immune response strong enough to eliminate transgene expression from the CNS. For the systemic immunization to eliminate transgene expression from the brain, > or = 1 x 10(7) infectious units (iu) of adenovirus need to be used as immunogen. Furthermore, this immune response eliminates >90% of transgene expression from 1 x 10(7)-1 x 10(3) iu of vector injected into the striatum 60 days earlier. Importantly, elimination of transgene expression is independent of the nature of the promoter that drives transgene expression and is accompanied by brain infiltration of CD8(+) T cells and macrophages. In conclusion, once the threshold for systemic immunization (i.e. 1 x 10(7) iu) is crossed, the immune response eliminates transgene expression by >90% even from brains that receive as little as 1000 iu of adenoviral vectors, independently of the type of promoter that drives expression.
Keywords: Gene therapy; adenovirus; neuroimmunology; promoter; threshold.
Figures


References
-
- Akrigg A, Wilkinson GW, Oram JD. The structure of the major immediate early gene of human cytomegalovirus strain AD169. Virus Research. 1985;2:107–121. - PubMed
-
- Amalfitano A, Parks RJ. Separating fact from fiction: assessing the potential of modified adenovirus vectors for use in human gene therapy. Current Gene Therapy. 2002;2:111–133. - PubMed
-
- Bemelmans AP, Horellou P, Pradier L, Brunet I, Colin P, Mallet J. Brain-derived neurotrophic factor-mediated protection of striatal neurons in an excitotoxic rat model of Huntington’s disease, as demonstrated by adenoviral gene transfer. Human Gene Therapy. 1999;10:2987–2997. - PubMed
Grants and funding
LinkOut - more resources
Full Text Sources
Research Materials
