Diabetic Cardiomyopathy in OVE26 Mice Shows Mitochondrial ROS Production and Divergence Between In Vivo and In Vitro Contractility
- PMID: 18084673
- PMCID: PMC2174063
- DOI: 10.1900/RDS.2007.4.159
Diabetic Cardiomyopathy in OVE26 Mice Shows Mitochondrial ROS Production and Divergence Between In Vivo and In Vitro Contractility
Abstract
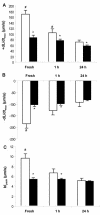
Many diabetic patients suffer from a cardiomyopathy that cannot be explained solely by poor coronary perfusion. This cardiomyopathy may be due to either organ-based damage like fibrosis, or to direct damage to cardiomyocytes. Mitochondrial-derived reactive oxygen species (ROS) have been proposed to contribute to this cardiomyopathy. To address these questions, we used the OVE26 mouse model of severe type 1 diabetes to measure contractility in isolated cardiomyocytes by edge detection and in vivo with echocardiography. We also assessed the source of ROS generation using both a general and a mitochondrial specific indicator. When contractility was assayed in freshly isolated myocytes, contraction was much stronger in control myocytes. However, contractility of normal myocytes became weaker during 24 hours of in vitro culture. In contrast, contractility of diabetic OVE26 myocytes remains stable during culture. Echocardiography revealed normal or hyperdynamic function in OVE26 hearts under basal conditions but with a sharply reduced response to isoproterenol, a beta-adrenergic agonist. For ROS generation, we found that ROS production in diabetic myocytes was elevated after exposure to either high glucose or angiotensin II (AngII). Superoxide detection with the mitochondrial sensor MitoSOX Red confirmed that mitochondria are a major source of ROS generation in diabetic myocytes. These results show that contractile deficits in OVE26 diabetic hearts are due primarily to cardiomyocyte impairment and that ROS from mitochondria are a cause of that impairment.
Figures


Similar articles
-
Catalase protects cardiomyocyte function in models of type 1 and type 2 diabetes.Diabetes. 2004 May;53(5):1336-43. doi: 10.2337/diabetes.53.5.1336. Diabetes. 2004. PMID: 15111504
-
Metallothionein prevents diabetes-induced deficits in cardiomyocytes by inhibiting reactive oxygen species production.Diabetes. 2003 Mar;52(3):777-83. doi: 10.2337/diabetes.52.3.777. Diabetes. 2003. PMID: 12606520
-
Cardiomyocyte dysfunction in models of type 1 and type 2 diabetes.Cardiovasc Toxicol. 2005;5(3):285-92. doi: 10.1385/ct:5:3:285. Cardiovasc Toxicol. 2005. PMID: 16244373
-
Cardiomyocyte defects in diabetic models and protection with cardiac-targeted transgenes.Methods Mol Med. 2005;112:379-88. doi: 10.1385/1-59259-879-x:379. Methods Mol Med. 2005. PMID: 16010031 Review.
-
Mitochondrial ROS Formation in the Pathogenesis of Diabetic Cardiomyopathy.Front Cardiovasc Med. 2020 Feb 18;7:12. doi: 10.3389/fcvm.2020.00012. eCollection 2020. Front Cardiovasc Med. 2020. PMID: 32133373 Free PMC article. Review.
Cited by
-
Application of Animal Models in Diabetic Cardiomyopathy.Diabetes Metab J. 2021 Mar;45(2):129-145. doi: 10.4093/dmj.2020.0285. Epub 2021 Mar 25. Diabetes Metab J. 2021. PMID: 33813812 Free PMC article. Review.
-
Improvement of cardiac functions by chronic metformin treatment is associated with enhanced cardiac autophagy in diabetic OVE26 mice.Diabetes. 2011 Jun;60(6):1770-8. doi: 10.2337/db10-0351. Epub 2011 May 11. Diabetes. 2011. PMID: 21562078 Free PMC article.
-
The role of mitochondrial function and cellular bioenergetics in ageing and disease.Br J Dermatol. 2013 Jul;169 Suppl 2(0 2):1-8. doi: 10.1111/bjd.12208. Br J Dermatol. 2013. PMID: 23786614 Free PMC article. Review.
-
Metabolic and Biochemical Stressors in Diabetic Cardiomyopathy.Front Cardiovasc Med. 2017 May 31;4:31. doi: 10.3389/fcvm.2017.00031. eCollection 2017. Front Cardiovasc Med. 2017. PMID: 28620607 Free PMC article. Review.
-
Metabolic inflexibility and protein lysine acetylation in heart mitochondria of a chronic model of type 1 diabetes.Biochem J. 2013 Jan 1;449(1):253-61. doi: 10.1042/BJ20121038. Biochem J. 2013. PMID: 23030792 Free PMC article.
References
-
- Jaffe AS, Spadaro JJ, Schechtman K, Roberts R, Geltman EM, Sobel BE. Increased congestive heart failure after myocardial infarction of modest extent in patients with diabetes mellitus. Am Heart J. 1984;108(1):31–37. - PubMed
-
- Bonow RO, Gheorghiade M. The diabetes epidemic: a national and global crisis. Am J Med. 2004;116(Suppl 5A):2S–10S. - PubMed
-
- Rubler S, Dlugash J, Yuceoglu YZ, Kumral T, Branwood AW, Grishman A. New type of cardiomyopathy associated with diabetic glomerulosclerosis. Am J Cardiol. 1972;30(6):595–602. - PubMed
-
- Brown RA, Walsh MF, Ren J. Influence of gender and diabetes on vascular and myocardial contractile function. Endocr Res. 2001;27(4):399–408. - PubMed
Grants and funding
LinkOut - more resources
Full Text Sources
