. 2008 Feb 20;506(6):989-1002.
doi: 10.1002/cne.21535.

Expression of receptors for glial cell line-derived neurotrophic factor family ligands in sacral spinal cord reveals separate targets of pelvic afferent fibers

Affiliations

Expression of receptors for glial cell line-derived neurotrophic factor family ligands in sacral spinal cord reveals separate targets of pelvic afferent fibers

Shelley L Forrest et al. J Comp Neurol. .

Abstract

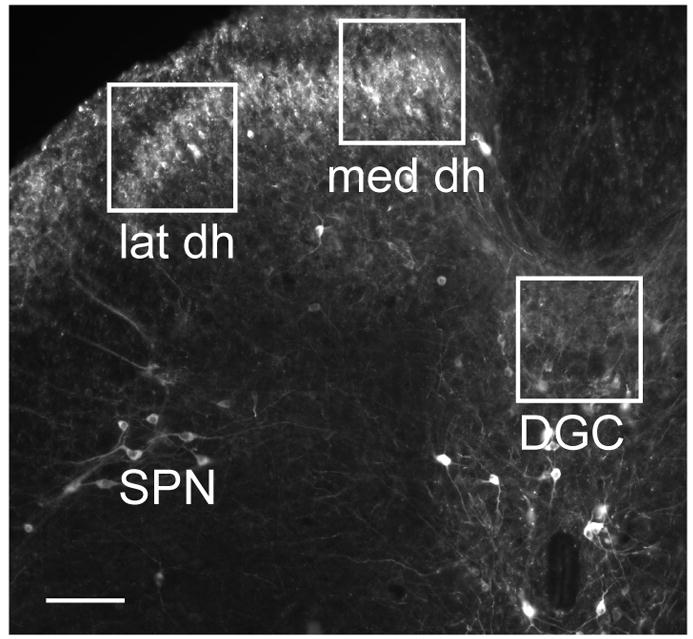
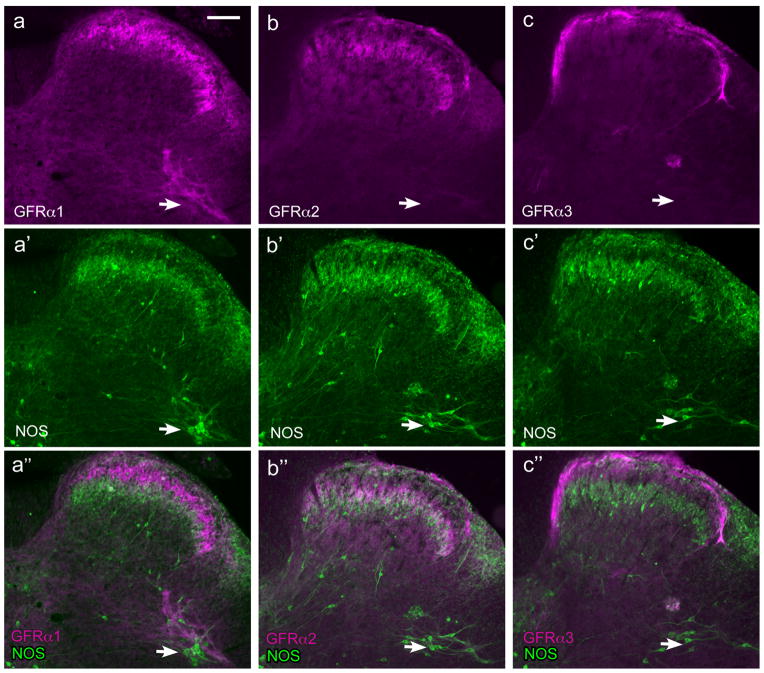
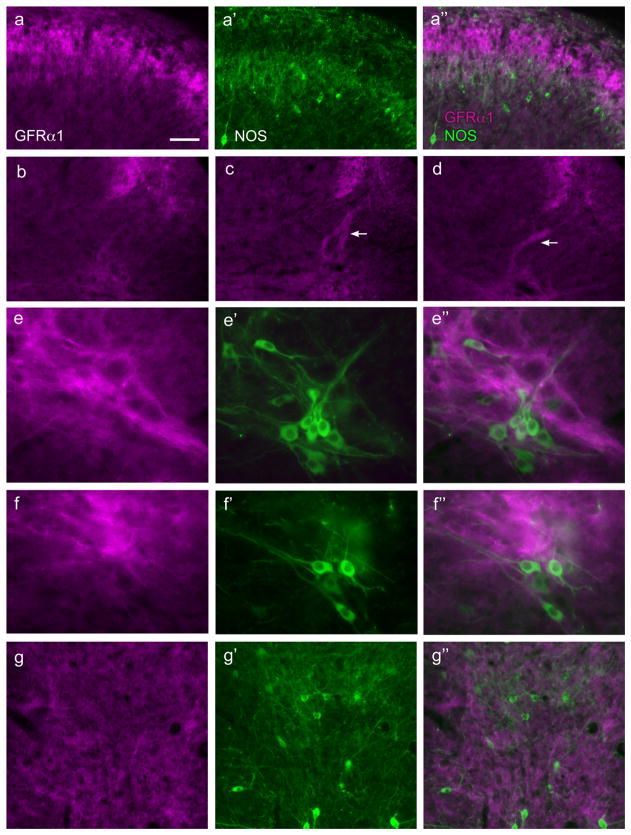
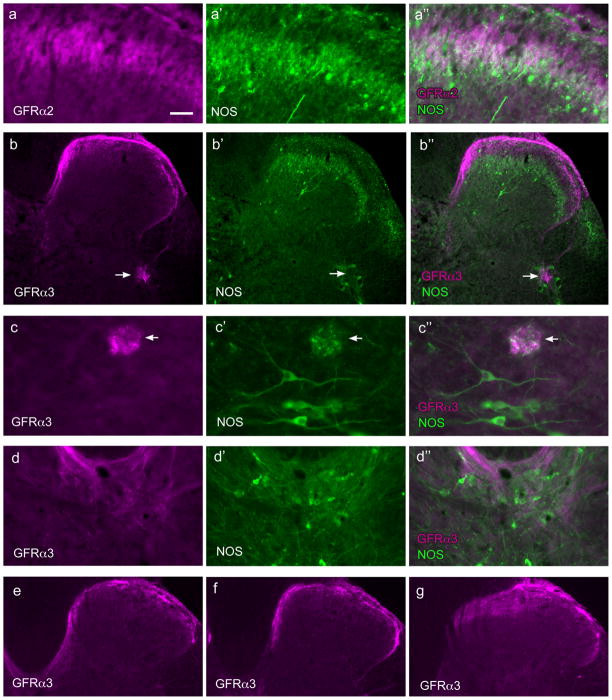
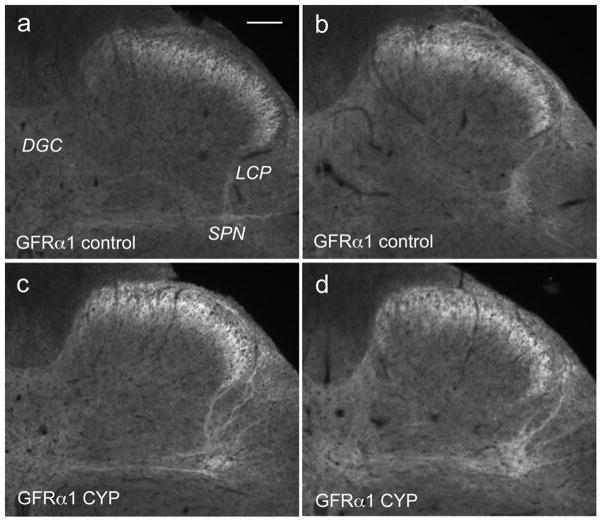
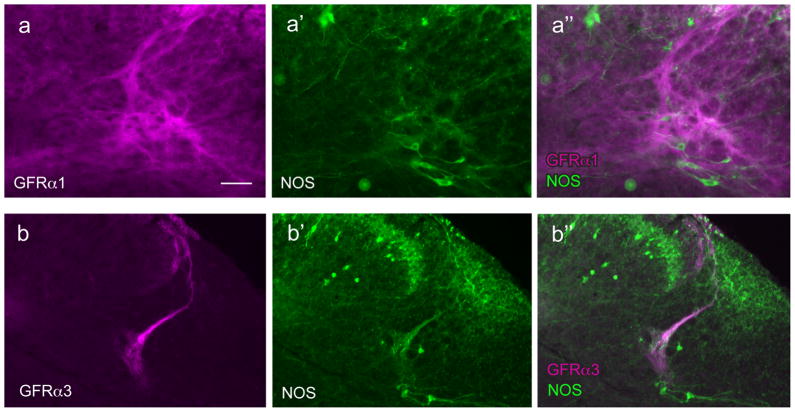
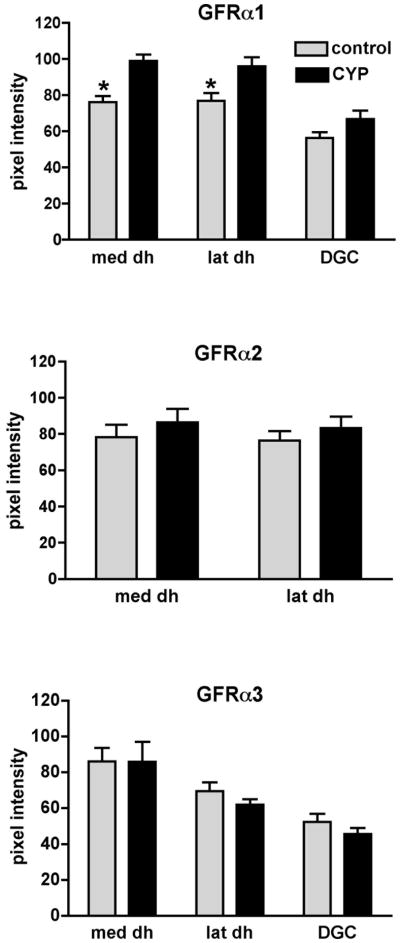
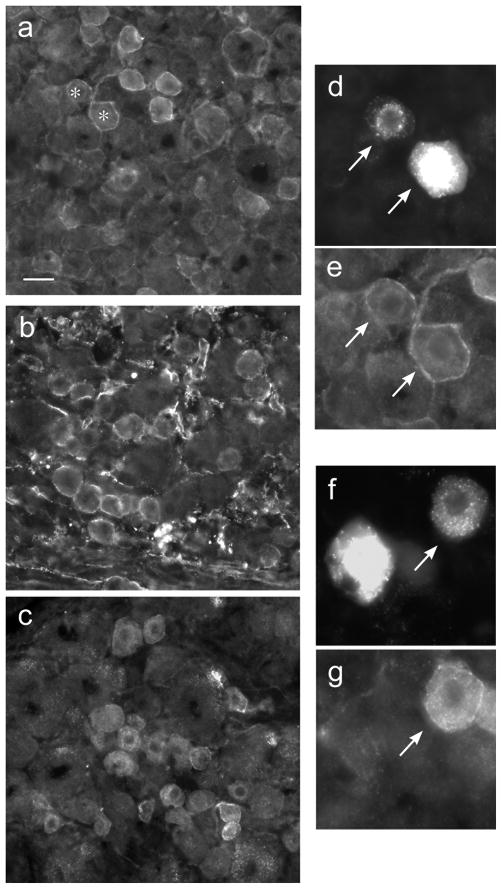
Nerve growth factor has been proposed to mediate many structural and chemical changes in bladder sensory neurons after injury or inflammation. We have examined the expression of receptors for the glial cell line-derived neurotrophic factor (GDNF) family within sensory terminals located in the sacral spinal cord and in bladder-projecting sacral dorsal root ganglion neurons of adult female Sprague-Dawley rats. Nerve fibers immunolabelled for GFRalpha1 (GDNF receptor), GFRalpha2 (neurturin receptor), or GFRalpha3 (artemin receptor) showed distinct distribution patterns in the spinal cord, suggesting separate populations of sensory fibers with different functions: GFRalpha1-labeled fibers were in outer lamina II and the lateral-collateral pathway and associated with autonomic interneurons and preganglionic neurons; GFRalpha2-labeled fibers were only in inner lamina II; GFRalpha3-labeled fibers were in lamina I, the lateral-collateral pathway, and areas surrounding dorsal groups of preganglionic neurons and associated interneurons. Immunofluorescence studies of retrogradely labelled bladder-projecting neurons in sacral dorsal root ganglia showed that approximately 25% expressed GFRalpha1 or GFRalpha3 immunoreactivity, the preferred receptors for GDNF and artemin, respectively. After cyclophosphamide-induced bladder inflammation, fluorescence intensity of GFRalpha1-positive fibers increased within the dorsal horn, but there was no change in the GFRalpha2- or GFRalpha3-positive fibers. These studies have shown that GDNF and artemin may target bladder sensory neurons and potentially mediate plasticity of sacral visceral afferent neurons following inflammation. Our results have also revealed three distinct subpopulations of sensory fibers within the sacral spinal cord, which have not been identified previously using other markers.


Figures

Figure 1
Figure 1
Regions of spinal cord chosen for densitometric quantitation of GFR-immunoreactivity. Cryosection of sacral spinal cord immunostained for nitric oxide synthase (NOS) showing size and position of regions chosen for densitometric analysis of GFR-immunoreactivity, using images taken under the 10x objective. Boxes were 250 pixels x 250 pixels and were aligned with the medial and lateral margins of the superficial dorsal horn (abbreviated med dh and lat dh, respectively). A similar area was also analysed in the dorsal gray commissure (DGC). The location of the sacral preganglionic nucleus (SPN) is also indicated. Calibration represents 100 μm.
Figure 2
Figure 2
Distribution of fibers showing GFRα1-, GFRα2- and GFRα3-immunoreactivity in sacral spinal cord. Each vertical set of three micrographs shows immunoreactivity (IR) for a GFR (a–c), nitric oxide synthase (NOS) to indicate dorsal horn lamination and preganglionic neurons (arrows) (a’–c’) and merged image (a’’–c’’). Images are oriented with dorsal surface at the top and medial cord on the left. a, GFRα1-IR fibers in the dorsal horn, and immediately dorsal to preganglionic neurons. b, GFRα2-IR fibers in the dorsal horn but not associated with preganglionic neurons. c, GFRα3-IR fibers in the dorsal horn and a small region dorsal to preganglionic neurons. Calibration bar represents 100 μm.
Figure 3
Figure 3
Distribution of GFRα1-immunoreactive fibers in the sacral spinal cord. Horizontal setS of three micrographs labelled a, e, f and g show immunoreactivity (IR) for GFRα1 (a, e, f, g), nitric oxide synthase (NOS; a’, e’, f’, g’), and a merged image (a’’, e’’, f’’, g’’). Images are oriented with dorsal surface at the top (all images) and medial cord on the left (a–f); g is located in the midline, dorsal to the central canal. a, fibers in superficial dorsal horn show minimal coexpression between GFRα1-IR and NOS. b–d, examples of variable prevalence of GFRα1-IR fibers in the lateral-collateral pathway between sections, with some sections showing no fibers (b) and others showing dense projections (c,d as indicated by arrows); panels b–d show identical regions of spinal cord. e,f, numerous fine GFRα1-IR fibers in the region dorsal to NOS-positive preganglionic neurons and also closely associated with a minority of preganglionic neurons. g, many fine GFRα1-IR fibers in the dorsal gray commissure; many NOS-positive neurons are located in this area but GFRα1-IR fibers do not appear to be preferentially localised with NOS-positive neurons. Calibration bar represents 25 μm (e,f), 40 μm (a,g) or 60 μm (b–d).
Figure 4
Figure 4
Distribution of GFRα2- and GFRα3-immunoreactive fibers in the sacral spinal cord. Each of the top four horizontal sets of three micrographs shows immunoreactivity (IR) for a GFR (a–d), nitric oxide synthase (NOS, a’–d’), and a merged image (a’’–d’’). Images are oriented with dorsal surface at the top (all images) and medial cord on the left (a–c,e); d is located in the midline, dorsal to the central canal. a, GFRα2-IR fibers co-located in a similar region of lamina II as NOS-IR fibers. b, GFRα3-IR fibers in the dorsal horn extend in a medial band almost to the midline where they branched off into the dorsal gray commissure, while laterally some GFRα3-IR fibers were found in the lateral-collateral pathway, terminating in a small region within the more dorsal preganglionic neurons (arrow). c shows example of a small patch of GFRα3-IR fibers (arrows) lying dorsal to the region containing preganglionic neurons; this region also contains some NOS-IR fibers. d, dorsal gray commissure contains some GFRα3-IR fibers, especially in the most dorsal region. Panels e, f and g show progressive changes in the distribution of GFRα3-IR fibers moving more rostrally in the spinal cord; e shows caudal L6 where the medially located fibers travelling towards the midline; f shows rostral L6 where these fibers extend less medially and g shows L5 where there are no medially projecting GFRα3-IR fibers; note that in L5 GFRα3-IR fibers extend well into lamina II of the medial dorsal horn. Calibration bar represents 20 μm (c), 30 μm (a), 60 μm (d) or 100 μm (b, e–g).
Figure 5
Figure 5
Effects of cyclophosphamide (CYP) treatment on GFRα1-immunoreactivity in sacral spinal cord. GFRα1-immunoreactivity(IR) is shown in sacral spinal cord from control (a,b) and CYP (c,d) treated animals. All images were taken in the same session and using the same camera settings and have not been processed in any way other than cropping. Images from CYP-treated animals show brighter fibers in the superficial dorsal horn, in the lateral collateral pathway (LCP) dorsal to the sacral preganglionic nucleus (SPN), and in the dorsal gray commissure (DGC). Calibration bar represents 100μm.
Figure 6
Figure 6
GFR-immunoreactivity associated with the sacral preganglionic nucleus in CYP-treated rats. Images are oriented with dorsal surface at the top (all images) and medial cord on the left. Each horizontal set of three micrographs shows a GFR (a,b), NOS (a’,b’) or a merged image (a’’,b’’). a, Extensive distribution of GFRα1-IR fibers immediately dorsal to the SPN, demonstrated by the location of NOS-IR somata. b, GFRα3-IR fibres formed a dense bundle in the lateral-collateral pathway and appeared to terminate dorsal to the SPN, indicated by the location of NOS-IR somata. Calibration bar represents 60 μm (a) and 100 μm (b).
Figure 7
Figure 7
Densitometric analysis of GFR-immunoreactivity in sacral spinal cord of control and cyclophosphamide (CYP)-treated animals. Histograms show mean ± SE of raw pixel intensity measurements taken from 6–10 randomly selected sections for each group and immunostain. CYP treatment caused a significant increase in GFRα1-IR pixel intensity in both medial and lateral dorsal dorsal horn but had no significant effect on the dorsal gray commissure, although there appeared to be a small increase (medial, P=0.002, lateral, P= 0.02, DGC, P=0.08, unpaired t test; n=6 control, n=4 CYP). CYP treatment had no effect on GFRα2- or GFRα3-IR pixel intensity (n=4 for both control and CYP groups). med dh, medial dorsal horn; lat dh, lateral dorsal horn; DGC, dorsal grey commissure.
Figure 8
Figure 8
Distribution of GFR – immunoreactivity in sacral dorsal root ganglia. a, Numerous GFRα1-immunoreactive (IR) neurons, showing weak to moderate cytoplasmic labelling but pronounced plasma membrane labelling. b, Many small- and medium-sized GFRα2-IR neurons, showing moderate cytoplasmic labelling and pronounced plasma membrane labelling. c, Many small- and medium-sized GFRα3-IR neurons, showing bright cytoplasmic labelling and pronounced plasma membrane labelling. d shows two bladder-projecting neurons retrogradely labelled with FluoroGold (arrows), one of which is much brighter than the other; both of these FluoroGold neurons show GFRα1-IR, as shown in panel e (note that these two neurons are present in the larger field shown at lower magnification in a, as indicated with asterisks). f shows another pair of FluoroGold-labeled bladder-projecting neurons but in this case only the neuron on the right (arrow) shows GFRα3-IR (g). Calibration represents 15 μm (d–g) and 30 μm (a–c).

References

    1. Albers KM, Woodbury CJ, Ritter AM, Davis BM, Koerber HR. Glial cell-line-derived neurotrophic factor expression in skin alters the mechanical sensitivity of cutaneous nociceptors. J Neurosci. 2006;26:2981–2990. - PMC - PubMed
    1. Averill S, McMahon SB, Clary DO, Reichardt LF, Priestley JV. Immunocytochemical localization of trkA receptors in chemically identified subgroups of adult rat sensory neurons. Eur J Neurosci. 1995;7:1484–1494. - PMC - PubMed
    1. Bennett DLH, Dmietrieva N, Priestley JV, Clary D, McMahon SB. trkA, CGRP and IB4 expression in retrogradely labelled cutaneous and visceral primary sensory neurones in the rat. Neurosci Letts. 1996;206:33–36. - PubMed
    1. Bennett DLH, Michael GJ, Ramachandran N, Munson JB, Averill S, Yan Q, McMahon SB, Priestley JV. A distinct subgroup of small DRG cells express GDNF receptor components and GDNF is protective for these neurons after nerve injury. J Neurosci. 1998;18:3059–3072. - PMC - PubMed
    1. Bennett DLH, Boucher TJ, Armanini MP, Poulsen KT, Michael GJ, Priestley JV, Phillips HS, McMahon SB, Shelton DL. The glial cell line-derived neurotrophic factor family receptor components are differentially regulated within sensory neurons after nerve injury. J Neurosci. 2000;20:427–437. - PMC - PubMed

Publication types

MeSH terms

Substances