. 2008 Jan 1;22(1):91-105.
doi: 10.1101/gad.1596308. Epub 2007 Dec 17.

beta-Catenin is a Nek2 substrate involved in centrosome separation

Affiliations

beta-Catenin is a Nek2 substrate involved in centrosome separation

Shirin Bahmanyar et al. Genes Dev. .

Abstract

beta-Catenin plays important roles in cell adhesion and gene transcription, and has been shown recently to be essential for the establishment of a bipolar mitotic spindle. Here we show that beta-catenin is a component of interphase centrosomes and that stabilization of beta-catenin, mimicking mutations found in cancers, induces centrosome splitting. Centrosomes are held together by a dynamic linker regulated by Nek2 kinase and its substrates C-Nap1 (centrosomal Nek2-associated protein 1) and Rootletin. We show that beta-catenin binds to and is phosphorylated by Nek2, and is in a complex with Rootletin. In interphase, beta-catenin colocalizes with Rootletin between C-Nap1 puncta at the proximal end of centrioles, and this localization is dependent on C-Nap1 and Rootletin. In mitosis, when Nek2 activity increases, beta-catenin localizes to centrosomes at spindle poles independent of Rootletin. Increased Nek2 activity disrupts the interaction of Rootletin with centrosomes and results in binding of beta-catenin to Rootletin-independent sites on centrosomes, an event that is required for centrosome separation. These results identify beta-catenin as a component of the intercentrosomal linker and define a new function for beta-catenin as a key regulator of mitotic centrosome separation.


Figures
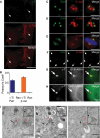
Figure 1.
Figure 1.
β-Catenin associates with interphase and mitotic centrosomes via its armadillo domain. (A) U-2 OS cells costained for γ-tubulin (γ-T; green) and β-catenin (β-cat; red). Arrows indicate colocalization of β-catenin with γ-tubulin. Bar, 10 μm. (B) Pearson correlation coefficient quantified for colocalization of γ-tubulin with pericentrin or β-catenin and for randomization of γ-tubulin channel in a 200 × 200-pixel square in the centrosome region and subsequent colocalization with pericentrin or β-catenin (n = 10). (C,D) Immunostaining of centrin (green) and β-catenin (red). G1/S-phase cell with two centrioles (C) or S/G2-phase cell with four centrioles (D). Bar, 2 μm. See also Supplemental Movie S1. (E) Immunostaining of mitotic U-2 OS cell with γ-tubulin (green), β-catenin (red), and DAPI (blue). Bar, 10 μm. (F) Centrosome-enriched fractions from nocodazole-treated U-2 OS cells costained with centrin (green) and β-catenin (red). Arrows mark colocalization of β-catenin with centrin-marked centrosomes. Note centrioles without β-catenin are also present, which indicates either that β-catenin was lost from centrioles during the purification procedure or that β-catenin localizes to a subset of centrioles. Bar, 10 μm (G,H) U-2 OS cells immunostained for γ-tubulin (red in merged image) and transiently expressing GFP-tagged Armadillo domain of β-catenin (G) or GFP-tagged ΔARM (H). Arrows indicate γ-tubulin-labeled centrosomes. Bar, 5 μm. (I) Immunogold labeling of β-catenin localization relative to centrioles in RPE-1 cells. Serial sectioning was performed in the centrosome region of 20 cells. β-Catenin label was found at the proximal (16%) and distal (60%) ends of centrioles, and between centrioles (4%), while labeling in surrounding areas was minimal. Twenty percent of the label on centrioles could not be assigned to either end. A single section is shown for each example. Insets show higher magnification of centrioles in panels a′–c′. Asterisks mark centrioles. (Panel a′) Cross-section of a centriole showing β-catenin near the “pinwheel” at the proximal end of the centriole (arrow). (Panel b′) Longitudinal section of a centriole showing β-catenin at the distal end (arrowhead), as identified by the subdistal and distal appendages. Arrow marks β-catenin at the proximal end of the centriole, relative to the appendages. (Panel c′) Example of β-catenin between centrioles. Bars: 0.5 μm; inset, 0.15 μm.
Figure 2.
Figure 2.
Dynamics of β-catenin and stabilized β-catenin (β-cat*) at centrosomes. (A) FRAP of GFP-β-catenin (gray montage) at centrosomes marked by RFP-pericentrin. Arrow marks photobleach region. Bar, 5 μm. (B) Fluorescence recovery profile of data in A. (C) Representative fluorescence recovery profile of GFP-β-catenin mutated in four GSK3β phosphorylation sites (β-cat*) at centrosomes. (D) Summary of average fluorescence recovery and t1/2 of GFP-β-catenin (blue; n = 4) and GFP-β-cat* (orange; n = 6) at centrosomes. Diffusion alone is shown as a black triangle (n = 2). Average of experiments is shown ± standard deviation. Student’s t-test was performed for recovery of β-cat and β-cat* with P = 0.011.
Figure 3.
Figure 3.
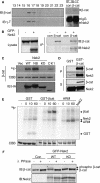
β-Catenin binds to and is phosphorylated by Nek2 in vitro and in vivo. (A; left) Centrosomes were isolated from HeLa cells (Kaplan et al. 2004) and sucrose fractions from the final purification step were subjected to immunoblot analysis for β-catenin and the centrosomal marker γ-tubulin. (right) β-Catenin was immunoprecipitated from fractions 16 and 17 and the immunoprecipitates were analyzed by immunoblot for β-catenin and Nek2. Data are from one experiment that is representative of two independent experiments. (B) Immunoblot of lysates from HEK 293T cells transfected with control or GFP-Nek2 expression vectors is shown at left. (Right) Lysates were incubated with control or β-catenin antibodies and immunoprecipitates were subjected to immunoblot analysis for β-catenin or Nek2. Data are from one experiment that is representative of four independent experiments. (C) HA-tagged wild-type (WT), activated (NB), or kinase-dead (KD) Nek2A, or wild-type CKIε (CK1), were immunoprecipitated from transfected HEK 293T cells and used in the in vitro kinase assays with γ-32PATP and recombinant β-catenin. (Top panel) Autoradiograph (32P). (Middle panel) Coomassie brilliant blue-stained SDS-PAGE gel (CBB). (Bottom panel) Anti-HA immunoblot (IB:HA). Data are from one experiment that is representative of five independent experiments. (D) Recombinant GST or GST-β-catenin bound to glutathione sepharose beads was incubated with recombinant His-Nek2A. Immunoblot was performed for β-catenin and Nek2 on the precipitated material (P) and the supernatants (S). Data are from one experiment that is representative of two independent experiments. (E) Recombinant full-length β-catenin (GST-β-cat) and the Armadillo domain of β-catenin (ARM) were incubated with recombinant His-Nek2A for 0, 10, or 60 min in the presence of γ-32PATP and separated by SDS-PAGE. A 60-min reaction containing His-Nek2A without substrate shows Nek2A autophosphorylation (Nek2 lane). A representative autoradiograph of the kinase assays is shown in the top panel (32P) and the corresponding Coomassie brilliant blue-stained gel is shown in the bottom panel (CBB). Data are from one experiment that is representative of four independent experiments. (F) HEK 293T cells were transfected with control vector (Con), wild-type GFP-Nek2 (WT), or kinase-dead GFP-Nek2 (KD), and the electrophoretic mobility of endogenous β-catenin was assessed by SDS-PAGE, followed by an immunoblot for β-catenin (IB:β-cat). Nek2 expression is shown in the bottom panel (IB:Nek2). Wild-type, but not kinase-dead Nek2, results in decreased electrophoretic mobility of β-catenin (denoted by asterisk at top left of shifted band), which is reversed by λ-phosphatase treatment (+). Data are from one experiment that is representative of two independent experiments.
Figure 4.
Figure 4.
Increased distance between centrosome and centrioles in stabilized β-catenin-expressing cells. (A,B) DNA content and immunostains, γ-tubulin (green) and DAPI (blue), of unsynchronized parental and stabilized β-catenin (β-cat*)-expressing cells. G1/S, 37%; S, 41%; S/G2, 17% in both cell lines. Percentage of cells in each phase was determined by the Dean-Jett-Fox algorithm (Bauer et al. 1998). Bar, 5 μm. (C) Average distance between γ-tubulin- and pericentrin-marked centrosomes in parental (n = 413), dox-repressed (+Dox; n = 300), and β-cat* (n = 424) cells. (D) Histogram showing intercentrosomal distance in parental, dox-repressed, and β-cat*-expressing cells. (E,F) DNA content and immunostains, glutamylated tubulin (GT335; green) and DAPI (blue), of parental and stabilized β-catenin (β-cat*)-expressing cells synchronized in G1/S by double-thymidine block. Parental: G1/S, 86.1%; G2/M, 8.7%. β-cat*: G1/S, 83.6%; G2/M, 7.6%. Bar, 5 μm. (G) Average distance between centrioles in parental (n = 173), dox-repressed (+Dox; n = 204), and β-cat*-expressing (n = 247) cells. (H) Histogram showing intercentriolar distance in parental, dox-repressed, and β-cat*-expressing cells. Average of three independent experiments ± standard error is shown. Student’s t-test was performed for wild-type (WT)/+D (combined) and β-cat* with P < 0.01.
Figure 5.
Figure 5.
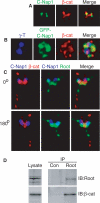
β-Catenin partially colocalizes with C-Nap1 and Rootletin, and is in a complex with Rootletin. (A) Projection of deconvolved sections of U-2 OS cells immunostained with C-Nap1 (green) and β-catenin (red). See also Supplemental Movies S4, a and b. (B) Projection of deconvolved sections of U-2 OS cells overexpressing GFP-C-Nap1 (green) in centrosome region and immunostained with γ-tubulin (blue) and β-catenin (red). (C) Three-dimensional rendering of deconvolved sections of U-2 OS cells immunostained with C-Nap1 (blue), β-catenin (red), and Rootletin (green). Two angles of a counterclockwise rotation are shown. See also Supplemental Movies S5, a and b. (D) MDCK lysates were incubated with control or Rootletin antibodies and immunoprecipitates were subjected to immunoblot analysis for β-catenin or Rootletin (shown at right).
Figure 6.
Figure 6.
C-Nap1 and Rootletin regulate binding of β-catenin in between centrosomes. (AC) U-2 OS cells immunostained for C-Nap1 (gray), Rootletin (green), and β-catenin (red). Merged images show C-Nap1 in blue. Control and siRNA images were taken at equal exposure times for each channel. (A) Control siRNA-treated cell with localization of β-catenin (red) to intercentrosomal linker region (arrow). (B, top panel) C-Nap1-siRNA-treated cell in which Rootletin (green) and β-catenin (red) are not localized to intercentrosomal linker region between centrosomes (arrows). (Bottom panel) C-Nap1 siRNA-treated cell with residual C-Nap1 at centrosomes (arrows). Rootletin (green) forms long continuous fibers and β-catenin (red) has broad punctate distribution. See Supplemental Figure S6 for additional examples of C-Nap1 siRNA-treated HeLa cells with striking colocalization of β-catenin puncta along Rootletin fibers, and quantitative fluorescence data showing loss of C-Nap1 from split centrosomes in C-Nap1 siRNA-treated cells. (C) Rootletin siRNA-treated cell in which β-catenin (red) is not localized to intercentrosomal linker region between centrosomes and is decreased at centrosomes (arrows). Bars, 5 μm. Graph shows mean fluorescence intensity per square micron for Rootletin (green) and β-catenin (red) in control (Con; n = 26 centrosomal puncta marked by C-Nap1) and Rootletin siRNA-treated (Root; n = 37 centrosomal puncta marked by C-Nap1) cells normalized for C-Nap1 (see Materials and Methods), which is unaffected by Root siRNA (Supplemental Fig. S6A; Bahe et al. 2005). Rootletin fluorescence intensity is significantly decreased at centrosomes in cells treated with Root siRNA as compared with control ([**] P < 0.0001), and the fluorescence intensity of β-catenin at centrosomes is significantly reduced in Root siRNA as compared with control siRNA-treated cells ([*] P = 0.0005). Mean ± standard error is shown.
Figure 7.
Figure 7.
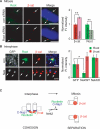
Regulation of β-catenin localization to centrosomes by Nek2. (A) Mitotic U-2 OS cells treated with control siRNA (top panel) and Rootletin siRNA (bottom panel). Arrows point to β-catenin (red) localization to centrosomes at spindle poles in the absence of Rootletin (green). DAPI (blue) marks chromosomes at metaphase plate. Bars, 10 μm. Graph shows normalized mean fluorescence intensity of β-catenin and Rootletin at interphase and mitotic centrosomes marked by γ-tubulin. A significant increase in β-catenin intensity at mitotic centrosomes (n = 21; [**] P < 0.0001) correlates with a significant decrease in Rootletin intensity at mitotic centrosomes (n = 21; [**] P < 0.0001). (B) Deconvolved section of GFP-expressing (top panel) and GFP-Nek2WT-expressing (bottom panel) HeLa cells (gray in single; blue in merge) immunostained for Rootletin (green) and β-catenin (red). Arrow in the top panel points to localization of β-catenin in between centrosomes. Arrows in the bottom panel point to β-catenin localization on, and not in between, centrosomes in the presence of GFP-Nek2WT. Bar, 2 μm. Graph shows normalized fluorescence intensity measurements of β-catenin and Rootletin in control, Nek2WT-expressing, and Nek2KD-expressing cells. Rootletin is significantly decreased from split centrosomes in Nek2WT-expressing cells as compared with control cells ([*] P = 0.016), whereas β-catenin is slightly increased. (C) Model for localization and regulation of β-catenin during centrosome cohesion and separation. In interphase, C-Nap1 provides sites that anchor and organize Rootletin and β-catenin to the intercentrosomal linker region. In mitosis, Nek2 activity results in the loss of Rootletin and C-Nap1 from centrosomes and binding of β-catenin to Rootletin-independent sites on centrosomes, an event that is required for centrosome separation.

Similar articles

Cited by

References

    1. Bahe S., Stierhof Y.D., Wilkinson C.J., Leiss F., Nigg E.A. Rootletin forms centriole-associated filaments and functions in centrosome cohesion. J. Cell Biol. 2005;171:27–33. - PMC - PubMed
    1. Barth A.I., Pollack A.L., Altschuler Y., Mostov K.E., Nelson W.J. NH2-terminal deletion of β-catenin results in stable colocalization of mutant β-catenin with adenomatous polyposis coli protein and altered MDCK cell adhesion. J. Cell Biol. 1997;136:693–706. - PMC - PubMed
    1. Barth A.I., Stewart D.B., Nelson W.J. T cell factor-activated transcription is not sufficient to induce anchorage-independent growth of epithelial cells expressing mutant β-catenin. Proc. Natl. Acad. Sci. 1999;96:4947–4952. - PMC - PubMed
    1. Bauer A., Lickert H., Kemler R., Stappert J. Modification of the E-cadherin–catenin complex in mitotic Madin-Darby canine kidney epithelial cells. J. Biol. Chem. 1998;273:28314–28321. - PubMed
    1. Behrens J. The role of the Wnt signalling pathway in colorectal tumorigenesis. Biochem. Soc. Trans. 2005;33:672–675. - PubMed

Publication types