

Phosphorylation by casein kinase 2 regulates Nap1 localization and function
- PMID: 18086883
- PMCID: PMC2258750
- DOI: 10.1128/MCB.01035-07
Phosphorylation by casein kinase 2 regulates Nap1 localization and function
Abstract
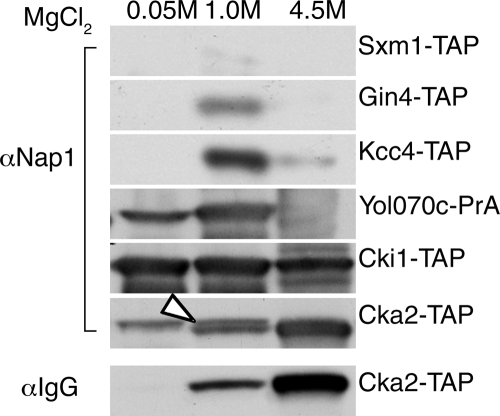
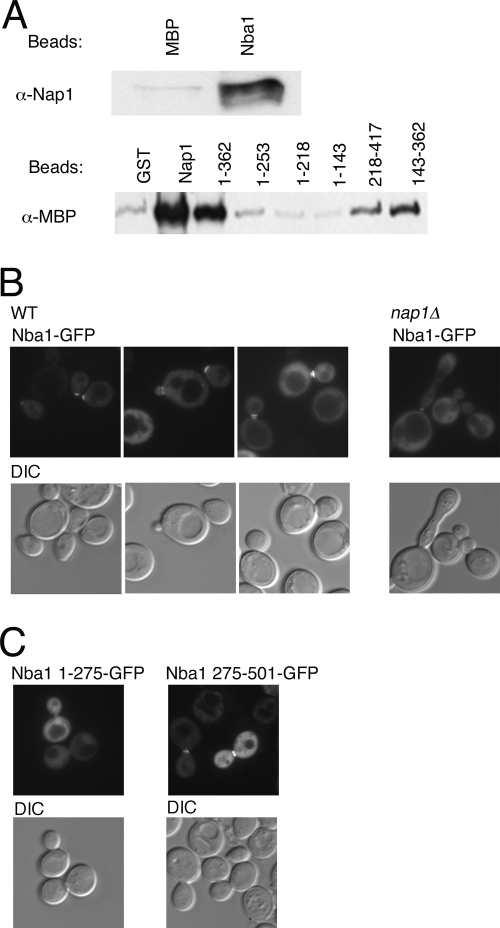
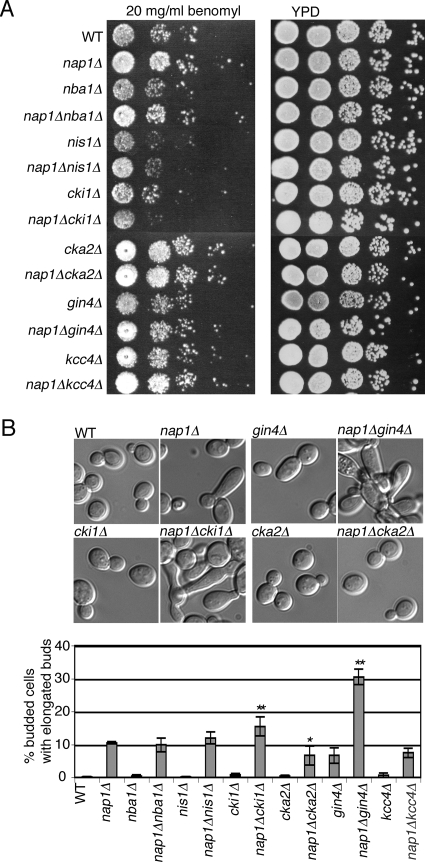
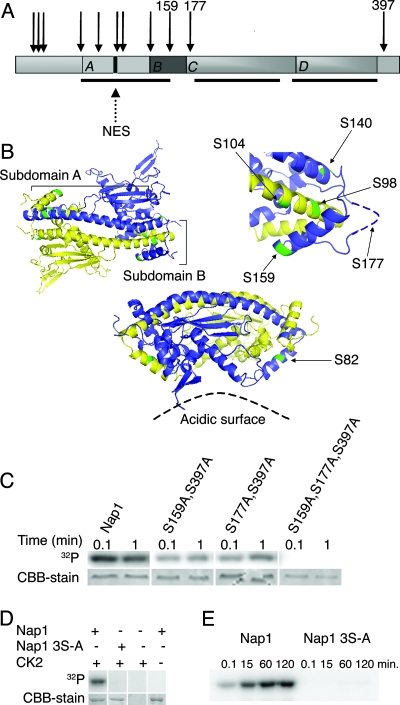
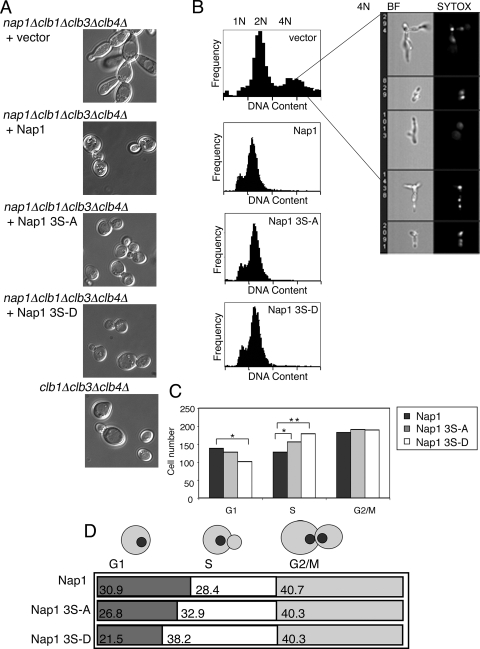
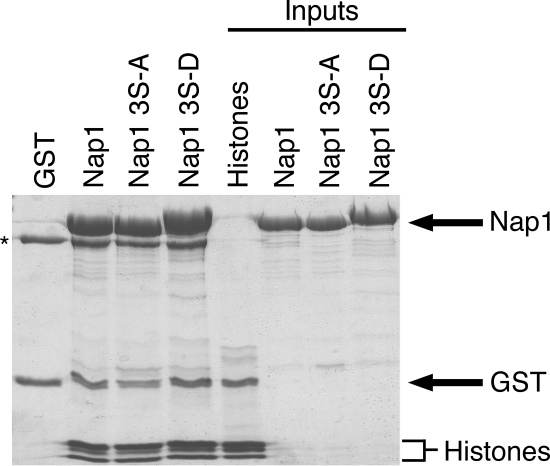
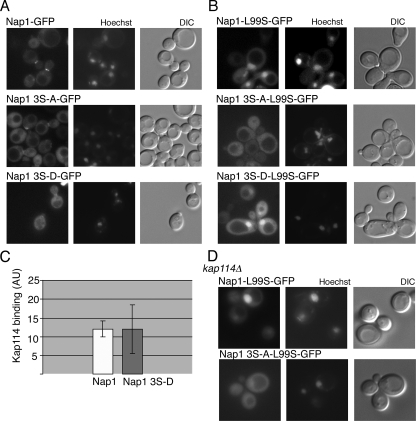
In Saccharomyces cerevisiae, the evolutionarily conserved nucleocytoplasmic shuttling protein Nap1 is a cofactor for the import of histones H2A and H2B, a chromatin assembly factor and a mitotic factor involved in regulation of bud formation. To understand the mechanism by which Nap1 function is regulated, Nap1-interacting factors were isolated and identified by mass spectrometry. We identified several kinases among these proteins, including casein kinase 2 (CK2), and a new bud neck-associated protein, Nba1. Consistent with our identification of the Nap1-interacting kinases, we showed that Nap1 is phosphorylated in vivo at 11 sites and that Nap1 is phosphorylated by CK2 at three substrate serines. Phosphorylation of these serines was not necessary for normal bud formation, but mutation of these serines to either alanine or aspartic acid resulted in cell cycle changes, including a prolonged S phase, suggesting that reversible phosphorylation by CK2 is important for cell cycle regulation. Nap1 can shuttle between the nucleus and cytoplasm, and we also showed that CK2 phosphorylation promotes the import of Nap1 into the nucleus. In conclusion, our data show that Nap1 phosphorylation by CK2 appears to regulate Nap1 localization and is required for normal progression through S phase.
Figures
Similar articles
-
Involvement of nucleocytoplasmic shuttling of yeast Nap1 in mitotic progression.Mol Cell Biol. 2003 Sep;23(18):6672-84. doi: 10.1128/MCB.23.18.6672-6684.2003. Mol Cell Biol. 2003. PMID: 12944491 Free PMC article.
-
Casein kinase 2 binds and phosphorylates the nucleosome assembly protein-1 (NAP1) in Drosophila melanogaster.J Mol Biol. 1999 Nov 12;293(5):1067-84. doi: 10.1006/jmbi.1999.3207. J Mol Biol. 1999. PMID: 10547286
-
Nap1 and Chz1 have separate Htz1 nuclear import and assembly functions.Traffic. 2010 Feb;11(2):185-97. doi: 10.1111/j.1600-0854.2009.01010.x. Epub 2009 Nov 19. Traffic. 2010. PMID: 19929865 Free PMC article.
-
Nuclear import of histones.Biochem Soc Trans. 2020 Dec 18;48(6):2753-2767. doi: 10.1042/BST20200572. Biochem Soc Trans. 2020. PMID: 33300986 Free PMC article. Review.
-
[Physiological functions of the acidic molecular chaperone Nap1].Seikagaku. 2005 Mar;77(3):206-12. Seikagaku. 2005. PMID: 15835307 Review. Japanese. No abstract available.
Cited by
-
Histone chaperones Nap1 and Vps75 regulate histone acetylation during transcription elongation.Mol Cell Biol. 2013 Apr;33(8):1645-56. doi: 10.1128/MCB.01121-12. Epub 2013 Feb 11. Mol Cell Biol. 2013. PMID: 23401858 Free PMC article.
-
Programmed cell death 5 mediates HDAC3 decay to promote genotoxic stress response.Nat Commun. 2015 Jun 16;6:7390. doi: 10.1038/ncomms8390. Nat Commun. 2015. PMID: 26077467 Free PMC article.
-
Phosphoregulation of Nap1 plays a role in septin ring dynamics and morphogenesis in Candida albicans.mBio. 2014 Feb 4;5(1):e00915-13. doi: 10.1128/mBio.00915-13. mBio. 2014. PMID: 24496790 Free PMC article.
-
Phosphorylation of bovine papillomavirus E1 by the protein kinase CK2 near the nuclear localization signal does not influence subcellular distribution of the protein in dividing cells.Arch Virol. 2016 Jan;161(1):165-9. doi: 10.1007/s00705-015-2641-6. Epub 2015 Oct 14. Arch Virol. 2016. PMID: 26467928 Free PMC article.
-
Organellar proteomics reveals hundreds of novel nuclear proteins in the malaria parasite Plasmodium falciparum.Genome Biol. 2012 Nov 26;13(11):R108. doi: 10.1186/gb-2012-13-11-r108. Genome Biol. 2012. PMID: 23181666 Free PMC article.
References
-
- Adachi, Y., G. N. Pavlakis, and T. D. Copeland. 1994. Identification and characterization of SET, a nuclear phosphoprotein encoded by the translocation break point in acute undifferentiated leukemia. J. Biol. Chem. 2692258-2262. - PubMed
-
- Adachi, Y., G. N. Pavlakis, and T. D. Copeland. 1994. Identification of in vivo phosphorylation sites of SET, a nuclear phosphoprotein encoded by the translocation breakpoint in acute undifferentiated leukemia. FEBS Lett. 340231-235. - PubMed
-
- Aitchison, J. D., M. P. Rout, M. Marelli, G. Blobel, and R. W. Wozniak. 1995. Two novel related yeast nucleoporins Nup170p and Nup157p: complementation with the vertebrate homologue Nup155p and functional interactions with the yeast nuclear pore-membrane protein Pom152p. J. Cell Biol. 1311133-1148. - PMC - PubMed
-
- Akada, R., J. Yamamoto, and I. Yamashita. 1997. Screening and identification of yeast sequences that cause growth inhibition when overexpressed. Mol. Gen. Genet. 254267-274. - PubMed
Publication types
MeSH terms
Substances
Grants and funding
LinkOut - more resources
Full Text Sources
Molecular Biology Databases