. 2008 Mar;57(3):757-69.
doi: 10.2337/db07-1441. Epub 2007 Dec 17.

Reversal of streptozotocin-induced diabetes in mice by cellular transduction with recombinant pancreatic transcription factor pancreatic duodenal homeobox-1: a novel protein transduction domain-based therapy

Affiliations

Reversal of streptozotocin-induced diabetes in mice by cellular transduction with recombinant pancreatic transcription factor pancreatic duodenal homeobox-1: a novel protein transduction domain-based therapy

Vijay Koya et al. Diabetes. 2008 Mar.

Abstract

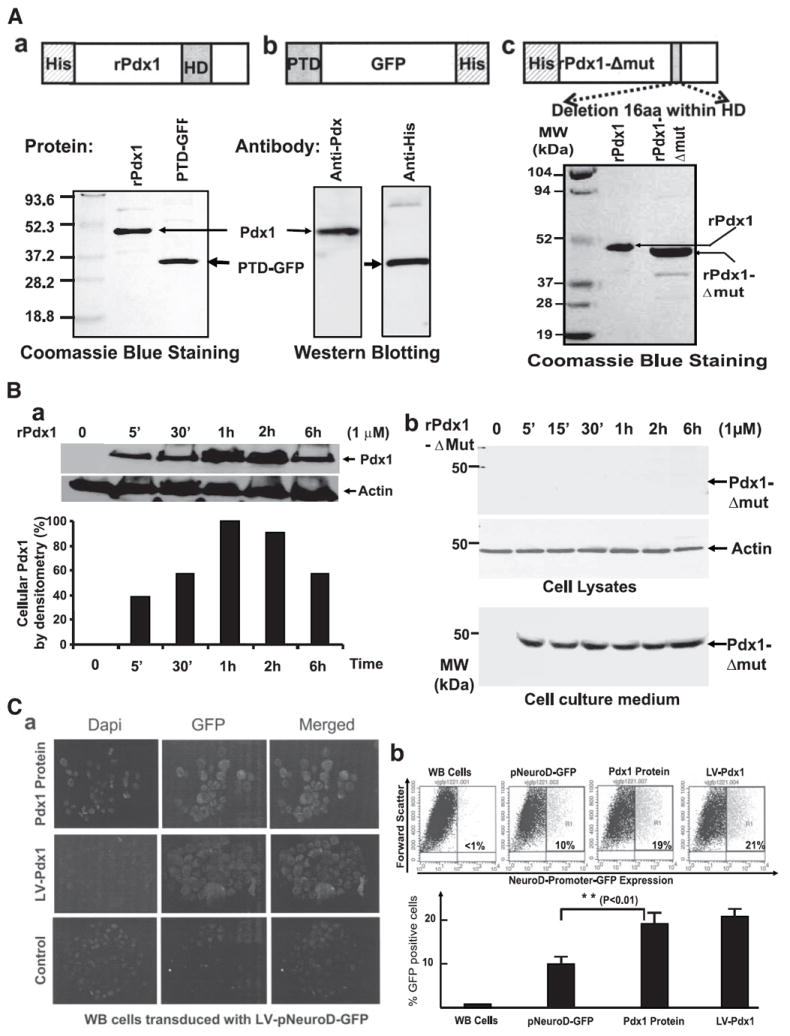
Objective: The key pancreatic transcription factor pancreatic duodenal homeobox-1 (Pdx1), known to control development and maintenance of pancreatic beta-cells, possesses a protein transduction domain (PTD) that facilitates its entry into cells. We therefore sought to evaluate the capacity of in vivo-administered recombinant Pdx1 (rPdx1) to ameliorate hyperglycemia in mice with streptozotocin-induced diabetes.

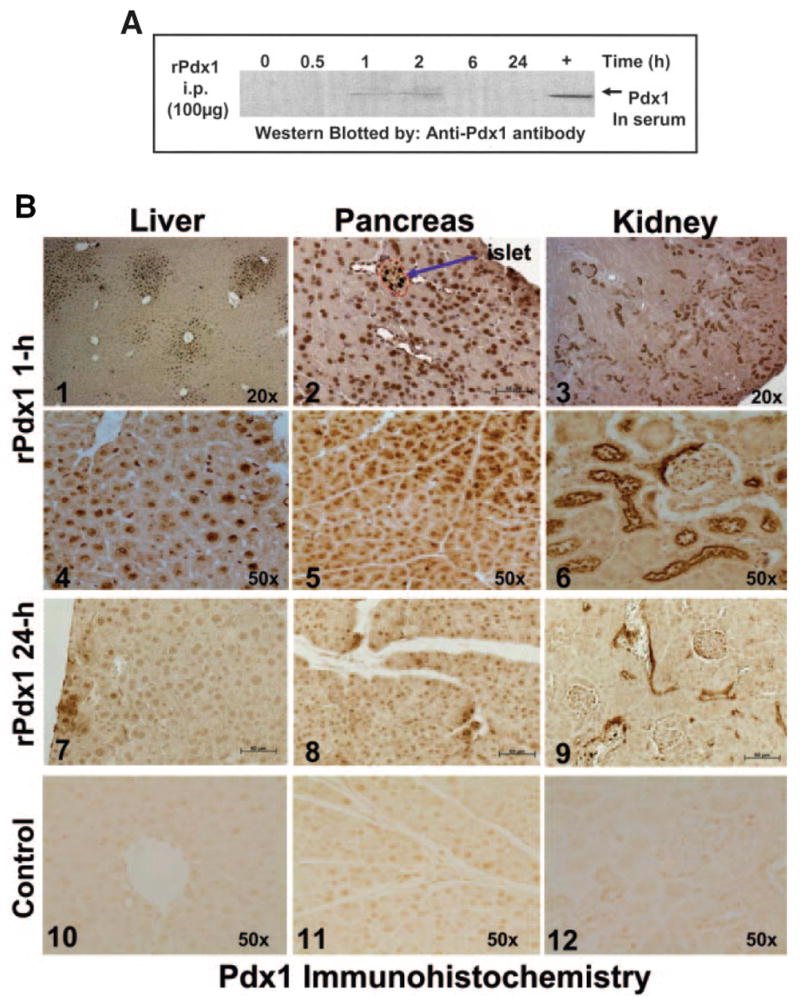
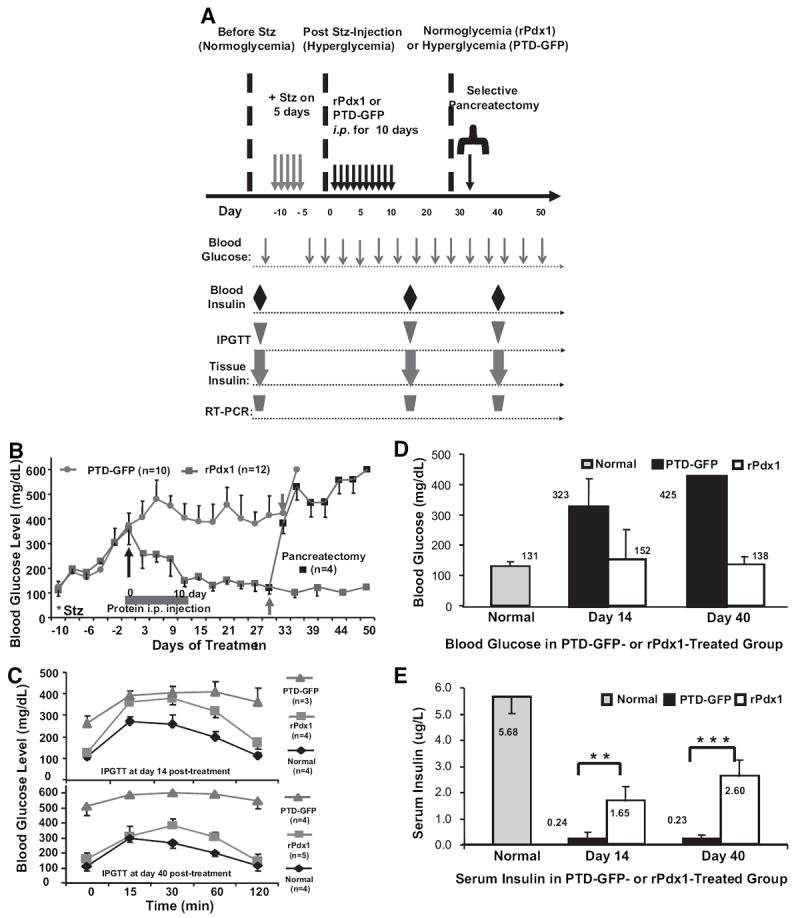
Research design and methods: Cell entry and transcriptional regulatory properties of rPdx1 protein and its PTD-deletion mutant rPdx1Delta protein, as well as a PTD-green fluorescent protein, were evaluated in vitro. After intraperitoneal rPdx1 injection into mice with streptozotocin-induced diabetes, we assessed its action on blood glucose levels, insulin content, intraperitoneal glucose tolerance test (IPGTT), Pdx1 distribution, pancreatic gene expression, islet cell proliferation, and organ histology.

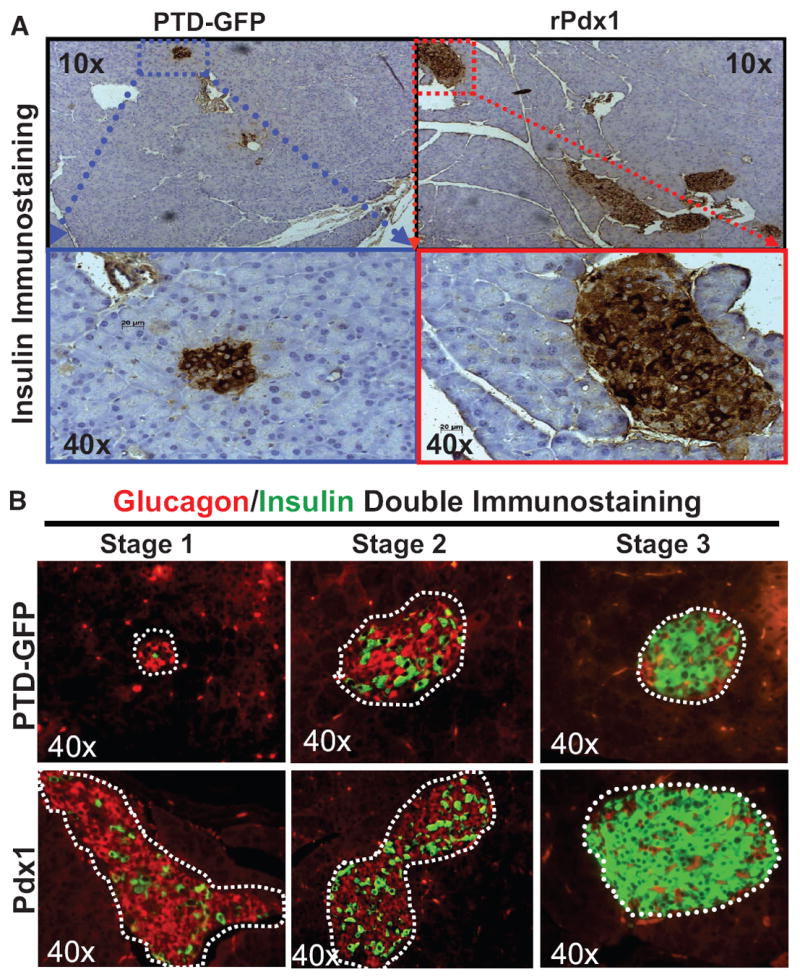
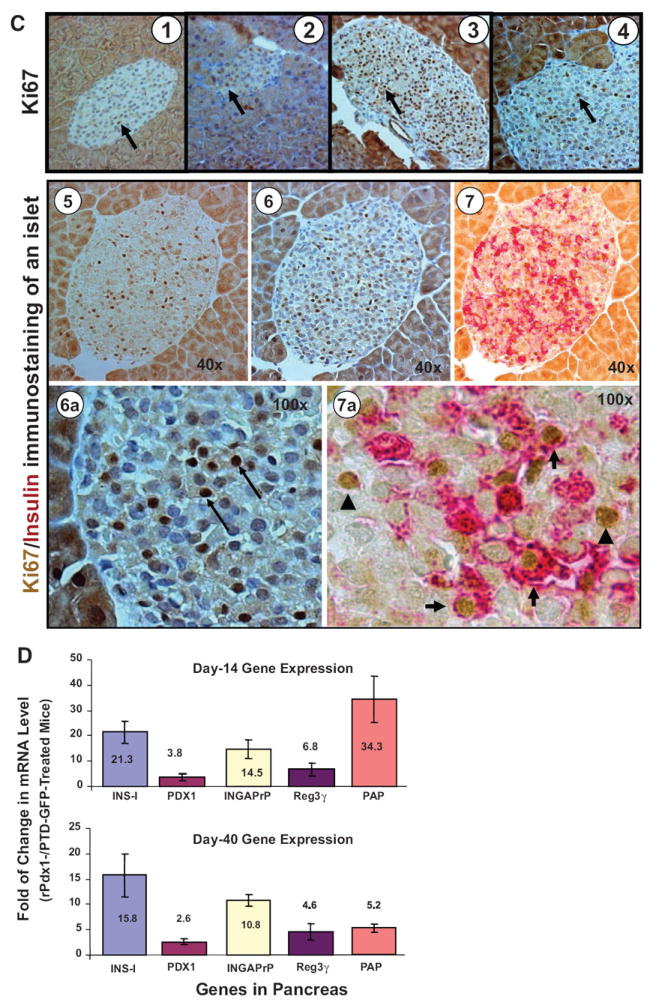
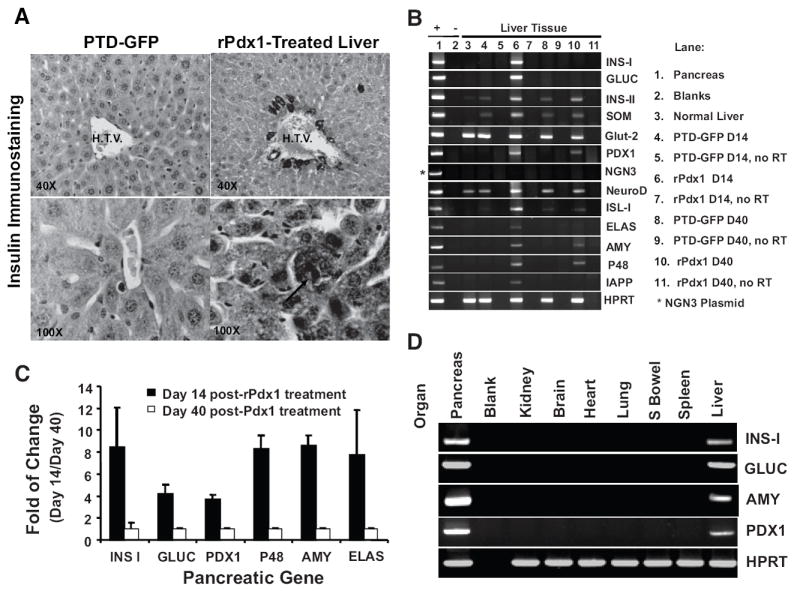
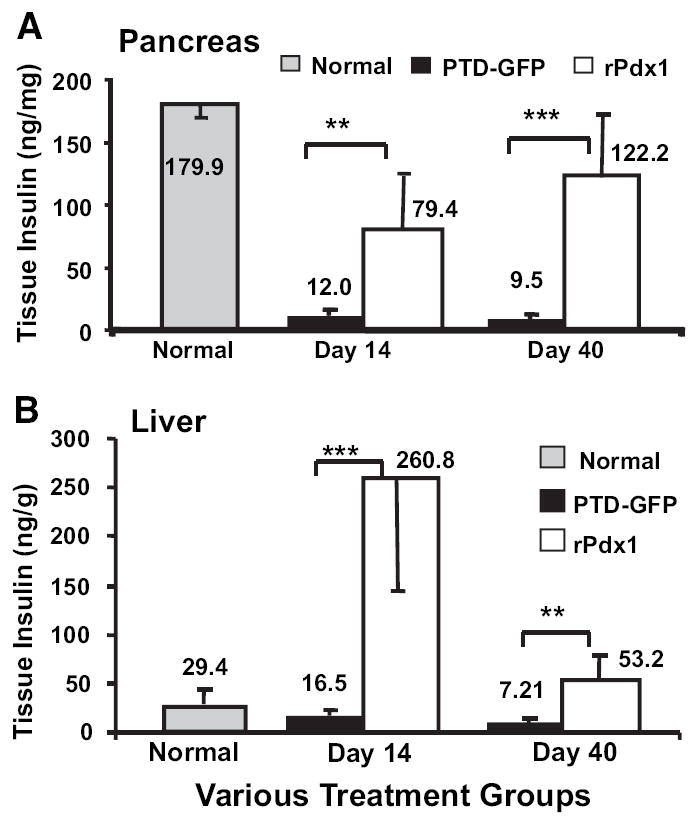
Results: Restoration of euglycemia in Pdx1-treated diabetic mice was evident by improved IPGTT and glucose-stimulated insulin release. Insulin, glucagon, and Ki67 immunostaining revealed increased islet cell number and proliferation in pancreata of rPdx1-treated mice. Real-time PCR of pancreas and liver demonstrated upregulation of INS and PDX1 genes and other genes relevant to pancreas regeneration. While the time course of beta-cell gene expression and serum/tissue insulin levels indicated that both liver- and pancreas-derived insulin contributed to restoration of normoglycemia, near-total pancreatectomy resulted in hyperglycemia, suggesting that beta-cell regeneration played the primary role in rPdx1-induced glucose homeostasis.

Conclusions: rPdx1 treatment of mice with streptozotocin-induced diabetes promotes beta-cell regeneration and liver cell reprogramming, leading to restoration of normoglycemia. This novel PTD-based protein therapy offers a promising way to treat patients with diabetes while avoiding potential side effects associated with the use of viral vectors.


Figures

FIG. 1
FIG. 1
Cloning, expression, purification, and characterization of rat Pdx1, PTD-GFP, and rPdx1-Δmut fusion proteins. A: Generation of fusion proteins. The top panel represents schematic structures of fusion proteins of rat Pdx1, PTD-GFP, and rPdx1-Δmut. The gray box represents the antennapedia-like PTD in the Pdx1 protein. The cDNAs coding rat Pdx1, mutant Pdx1, or PTD-GFP were cloned into the expression plasmid. Proteins were expressed and purified by an Ni-column. The bottom panel showed purified proteins in a 10% SDS-PAGE gel stained with Coomassie Blue (left and right panels). The middle panel is confirmation of the fusion proteins by Western blotting using anti-Pdx1 antibody (left lane) and anti–his-tag antibody (right lane). B: Time course of cell entry of rPdx1 and rPdx1-Δmut proteins. WB cells were incubated with rPdx1 or rPdx1-Δmut at a final concentration of 1 μmol/l for indicated times. Proteins were detected by Western blotting with rabbit anti-Pdx1 (1:1,000) or anti-actin (1:5,000) antibodies. The relative amount of cellular rPdx1 protein was quantified by densitometry and the values normalized to actin (left panel). The peak reading was defined as 100%, and the remaining values were divided by the highest reading to determine the relative amount of cellular rPdx1 protein. The right bottom panel shows rPdx1 protein levels in the culture medium by the end of the treatment. C: Functional analysis of rPdx1 protein. WB cells were transduced by the LV-pNeuroD-GFP reporter gene. The WB cells expressing pNeuroD-GFP reporter gene were visualized and quantified at 72 h posttreatment, with either rPdx1 protein or LV-Pdx1, by fluorescence microscopy and flow cytometry. Left panels (a) show fluorescence images of pNeuroD-GFP–expressing cells on cytospin slides. The right upper panel (b) shows flow dot plots. The lower panel is a histogram showing percentage of green fluorescent protein–expressing cells. Data are representative of three independent experiments.
FIG. 2
FIG. 2
In vivo kinetics and tissue distribution of rPdx1 following intraperitoneal injection. A: Kinetics of blood rPdx1 levels. Normal BALB/c mice were injected intraperitoneally with rPdx1 protein (0.1 mg/mouse). Blood samples were collected at indicated times, and 20 μl serum/lane was loaded in SDS-PAGE gels. The rPdx1 was detected by Western blotting with anti-Pdx1 antibody. B: In vivo tissue distribution of rPdx1. Liver, pancreas, and kidney tissues were harvested at 1 or 24 h after rPdx1 intraperitoneal injection and fixed in 10% formalin. Paraffin sections were immunostained with anti-Pdx1 antibody (1:1,000). Typical distribution patterns of rPdx1 protein in liver (1, 4, and 7), pancreas (2, 5, and 8), and kidney (3, 6, and 9) were visualized by light microscopy at 1 h (upper two rows) and 24 h (third row) posttreatment. Pdx1 immunostaining of the liver, pancreas, and kidney tissue sections from normal mice is indicated in the bottom row (10-12). The arrow in B2 indicates a small islet in the pancreas with strong nuclear Pdx1 immunostaining.
FIG. 3
FIG. 3
A: Experimental timeline. Timing of streptozotocin (Stz) treatment* with rPdx1 or PTD-GFP proteins and selective pancreatectomy are indicated in the top panel. The bottom panel shows the timing of blood glucose determinations and the measurement of blood insulin levels, IPGTT, measurement of tissue insulin, and the determination of gene expression by RT-PCR (see RESEARCH DESIGN AND METHODS). B: In vivo effects of rPdx1 protein on blood glucose levels. Diabetic BALB/c mice were treated with daily intraperitoneal injections of 0.1 mg rPdx1 or PTD-GFP for 10 consecutive days (long arrow), and blood glucose levels were determined by glucometer. Nearly total pancreatectomy was performed in selected control and rPdx1-treated mice at day 30 (short arrow). C: IPGTT. The IPGTT was performed as described in RESEARCH DESIGN AND METHODS, and blood glucose was measured at 0, 15, 30, 60, and 120 min in normal, rPdx1-, or PTD-GFP–treated mice. D: Blood glucose levels. E: Insulin levels following IPGTT. Glucose and insulin levels were measured in rPdx1- and PTD-GFP–treated mice 15 min after IPGTT on days 14 and 40 posttreatment (n ≥ 5 mice per group). **P < 0.05; ***P < 0.001 (Student’s t test).
FIG. 4
FIG. 4
Pdx1 protein promotes pancreatic islet cell regeneration. A: Insulin immunohistochemistry. Paraffin-embedded pancreas tissues from mice treated with either PTD-GFP (left) or rPdx1 (right) were sectioned and immunostained with anti-insulin antibody (1:1,000). B: Insulin/glucagon double immunostaining of pancreatic tissue. Paraffin sections from PTD-GFP– and rPdx1-treated mouse pancreas tissues were immunostained with both rabbit anti-glucagon/phycoethrin (red) and Guinea pig anti-insulin/FITC (green) and visualized under fluorescence microscopy. Based on the α-cell–to–β-cell ratio and distribution patterns, the pancreatic islets could be arbitrarily divided into three stages: stage 1, α-cell–to–β-cell ratio ~5:1, showing abundant disorganized glucagon-positive α-cells with few scattered β-cells; stage 2, α-cell–to–β-cell ratio 1:1; and stage 3, α-cell–to–β-cell ratio 1:5, showing a reversed ratio with predominantly insulin-producing β-cells. The architecture of the islets from stage 1 to 3 became more organized, with concurrence of increased numbers of insulin-producing β-cells. C: Ki67/insulin immunostaining of pancreatic tissue. Paraffin sections from normal pancreas or pancreas from diabetic mice treated with PTD-GFP or rPdx1 (day 14 or day 40) were first immunostained with anti–nuclear antigen Ki67 antibody (1:100) and then counterstained for nuclear chromatin following antigen retrieval (Panels 1–4). Panels 5–7 show an islet that was first stained for Ki67 (Panel 5), counterstained (Panel 6), and then stained for insulin (Panel 7). Panels 6a and 7a are high-power views of Panels 6 and 7. Ki67 nuclear protein was stained in brown (arrows, Panel 6a) and cytoplasmic insulin in red. In panel 7a, arrowheads indicate non–β cells and arrows β-cells in an islet. D: Quantitative RT-PCR analyses. Total RNA from diabetic mouse pancreas (days 14 and 40 post –rPdx1 or –PTD-GFP treatment) was used for real-time PCR analysis of INS-I, PDX1, INGAPrP, Reg3γ, and PAP gene expression. Expression levels are normalized to actin gene expression. Data are from ≥3 mice/group. INGAPrP, islet neogenesis-associated protein related protein; PAP, pancreatitis-associated protein; Reg3γ, regenerating islet-derived 3γ.
FIG. 4
FIG. 4
Pdx1 protein promotes pancreatic islet cell regeneration. A: Insulin immunohistochemistry. Paraffin-embedded pancreas tissues from mice treated with either PTD-GFP (left) or rPdx1 (right) were sectioned and immunostained with anti-insulin antibody (1:1,000). B: Insulin/glucagon double immunostaining of pancreatic tissue. Paraffin sections from PTD-GFP– and rPdx1-treated mouse pancreas tissues were immunostained with both rabbit anti-glucagon/phycoethrin (red) and Guinea pig anti-insulin/FITC (green) and visualized under fluorescence microscopy. Based on the α-cell–to–β-cell ratio and distribution patterns, the pancreatic islets could be arbitrarily divided into three stages: stage 1, α-cell–to–β-cell ratio ~5:1, showing abundant disorganized glucagon-positive α-cells with few scattered β-cells; stage 2, α-cell–to–β-cell ratio 1:1; and stage 3, α-cell–to–β-cell ratio 1:5, showing a reversed ratio with predominantly insulin-producing β-cells. The architecture of the islets from stage 1 to 3 became more organized, with concurrence of increased numbers of insulin-producing β-cells. C: Ki67/insulin immunostaining of pancreatic tissue. Paraffin sections from normal pancreas or pancreas from diabetic mice treated with PTD-GFP or rPdx1 (day 14 or day 40) were first immunostained with anti–nuclear antigen Ki67 antibody (1:100) and then counterstained for nuclear chromatin following antigen retrieval (Panels 1–4). Panels 5–7 show an islet that was first stained for Ki67 (Panel 5), counterstained (Panel 6), and then stained for insulin (Panel 7). Panels 6a and 7a are high-power views of Panels 6 and 7. Ki67 nuclear protein was stained in brown (arrows, Panel 6a) and cytoplasmic insulin in red. In panel 7a, arrowheads indicate non–β cells and arrows β-cells in an islet. D: Quantitative RT-PCR analyses. Total RNA from diabetic mouse pancreas (days 14 and 40 post –rPdx1 or –PTD-GFP treatment) was used for real-time PCR analysis of INS-I, PDX1, INGAPrP, Reg3γ, and PAP gene expression. Expression levels are normalized to actin gene expression. Data are from ≥3 mice/group. INGAPrP, islet neogenesis-associated protein related protein; PAP, pancreatitis-associated protein; Reg3γ, regenerating islet-derived 3γ.
FIG. 5
FIG. 5
Pdx1 protein promotes liver cell transdifferentiation into insulin-producing cells. A: Insulin immunohistochemical staining. Paraffin sections from liver were stained with anti-insulin antibody (1:250). Representative images were taken at 40× (upper panel) or 100× (lower panel) magnification. Insulin-positive cells are seen in the rPdx1-treated mouse liver section at day 14 posttreatment. Arrow, condensed nuclear chromatin of a bilobed-nucleated insulin-expressing liver cell. HTV, hepatic terminal vein. B: Expression of pancreatic genes in the liver. RT-PCR amplification of RNA extracted from livers of normal, PTD-GFP–, or rPdx1-treated mice were analyzed by agarose gel electrophoresis. RNA from mouse pancreas was used as a positive control. For Ngn3 RT-PCR analysis, Ngn3 cDNA plasmid (*) was used as positive control because adult pancreas does not express this gene. No RT, no reverse transcription. C: Quantitative RT-PCR analyses of pancreatic gene expression in livers. Total RNA from diabetic mouse liver (days 14 and 40 post–rPdx1 treatment) was analyzed by real-time PCR for the expression of five Pdx1 target genes (INS-I, GLUC, PDX1, p48, AMY, ELAS). Expression levels are normalized to actin gene expression. Fold changes (D14 over D40) are representative of data from ≥3 mice/group. D: Expression of pancreatic genes in other organs. Total RNA from other organs of rPdx1-treated diabetic mice at day 14 posttreatment and expression of four key pancreatic genes (INS-I, GLUC, AMY, and PDX1) were examined by RT-PCR. Data are from ≥3 mice/group and are representative of three independent experiments.
FIG. 6
FIG. 6
Pancreas and liver tissue insulin measurements. A: Pancreatic tissue insulin. Normal (n = 4) or diabetic mice treated with either PTD-GFP (n = 4) or rPdx1 (day 14, n = 6; day 40, n = 5) intraperitoneally for 10 consecutive days were killed at days 14 or 40 postinjection. The entire liver or pancreas was weighed before extracting tissue insulin to reduce sampling variation. Tissue insulin content in the pancreas is expressed as the amount of insulin (ng/mg) wet weight of pancreatic tissue. **P < 0.05; ***P < 0.001, Student’s t test. B: Liver tissue insulin measurement. Liver tissue insulin was extracted as described above. Insulin content is expressed as the amount of insulin (ng/g) wet weight of liver tissue. At day 14, the liver insulin content was significantly higher in the rPdx1-treated mice (n = 6) than in liver from normal (n = 4) or PTD-GFP–treated (n = 5) mice. **P < 0.05; ***P < 0.001, Student’s t test.

Similar articles

Cited by

References

    1. Bonner-Weir S, Weir GC. New sources of pancreatic beta-cells. Nat Biotechnol. 2005;23:857–861. - PubMed
    1. Meier JJ, Bhushan A, Butler PC. The potential for stem cell therapy in diabetes. Pediatr Res. 2006;59:65R–73R. - PubMed
    1. Trucco M. Is facilitating pancreatic beta cell regeneration a valid option for clinical therapy? Cell Transplant. 2006;15(Suppl. 1):S75–S84. - PubMed
    1. Perfetti R, Zhou J, Doyle ME, Egan JM. Glucagon-like peptide-1 induces cell proliferation and pancreatic-duodenum homeobox-1 expression and increases endocrine cell mass in the pancreas of old, glucose-intolerant rats. Endocrinology. 2000;141:4600–4605. - PubMed
    1. Stoffers DA, Kieffer TJ, Hussain MA, Drucker DJ, Bonner-Weir S, Habener JF, Egan JM. Insulinotropic glucagon-like peptide 1 agonists stimulate expression of homeodomain protein IDX-1 and increase islet size in mouse pancreas. Diabetes. 2000;49:741–748. - PubMed

Publication types

MeSH terms