

Drosophila TIF-IA is required for ribosome synthesis and cell growth and is regulated by the TOR pathway
- PMID: 18086911
- PMCID: PMC2140016
- DOI: 10.1083/jcb.200709044
Drosophila TIF-IA is required for ribosome synthesis and cell growth and is regulated by the TOR pathway
Abstract
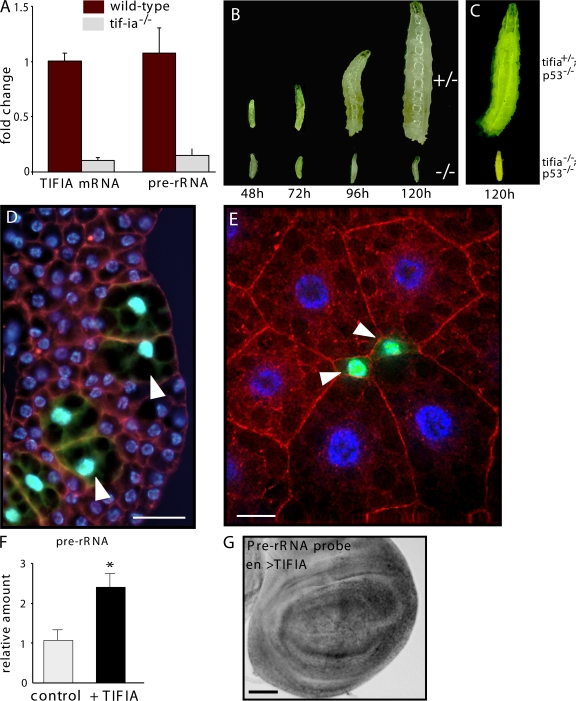
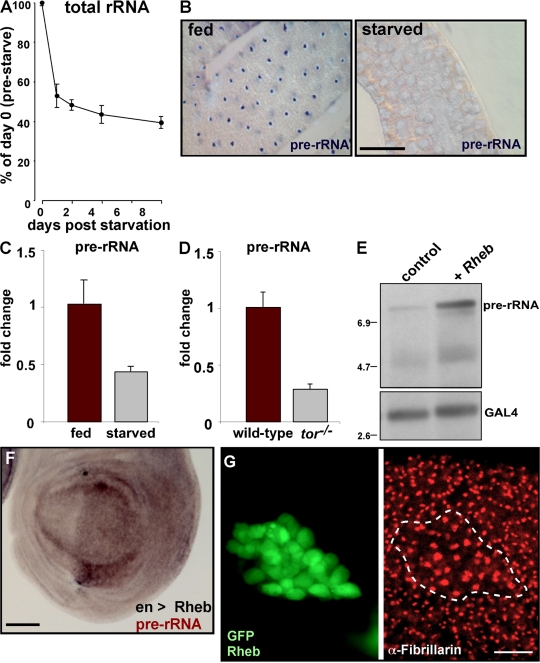
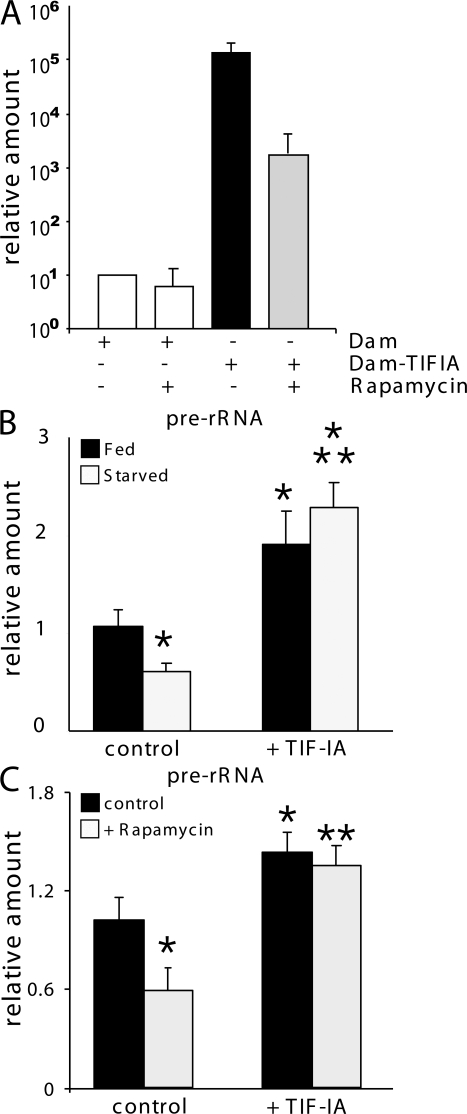
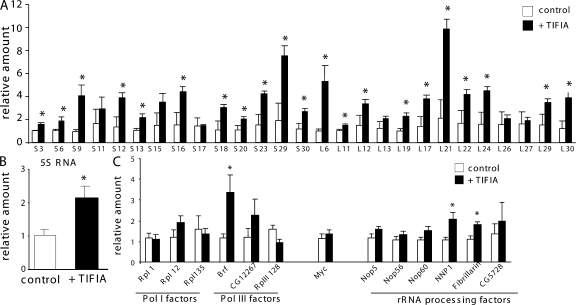
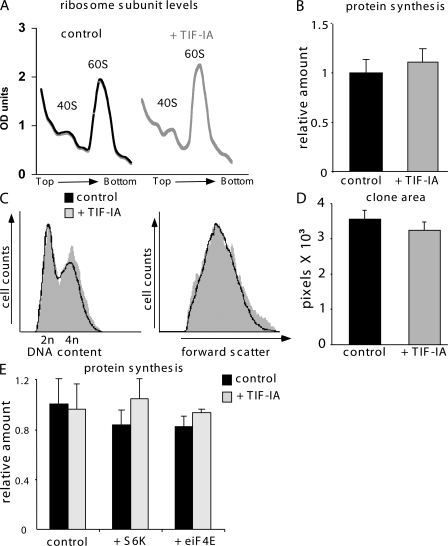
Synthesis of ribosomal RNA (rRNA) is a key step in ribosome biogenesis and is essential for cell growth. Few studies, however, have investigated rRNA synthesis regulation in vivo in multicellular organisms. Here, we present a genetic analysis of transcription initiation factor IA (TIF-IA), a conserved RNA polymerase I transcription factor. Drosophila melanogaster Tif-IA(-/-) mutants have reduced levels of rRNA synthesis and sustain a developmental arrest caused by a block in cellular growth. We find that the target of rapamycin (TOR) pathway regulates TIF-IA recruitment to rDNA. Furthermore, we show that the TOR pathway regulates rRNA synthesis in vivo and that TIF-IA overexpression can maintain rRNA transcription when TOR activity is reduced in developing larvae. We propose that TIF-IA acts in vivo as a downstream growth-regulatory target of the TOR pathway. Overexpression of TIF-IA also elevates levels of both 5S RNA and messenger RNAs encoding ribosomal proteins. Stimulation of rRNA synthesis by TIF-IA may therefore provide a feed-forward mechanism to coregulate the levels of other ribosome components.
Figures
Similar articles
-
TIF-IA-dependent regulation of ribosome synthesis in drosophila muscle is required to maintain systemic insulin signaling and larval growth.PLoS Genet. 2014 Oct 30;10(10):e1004750. doi: 10.1371/journal.pgen.1004750. eCollection 2014 Oct. PLoS Genet. 2014. PMID: 25356674 Free PMC article.
-
The EGF/Ras pathway controls growth in Drosophila via ribosomal RNA synthesis.Dev Biol. 2018 Jul 1;439(1):19-29. doi: 10.1016/j.ydbio.2018.04.006. Epub 2018 Apr 13. Dev Biol. 2018. PMID: 29660312
-
mTOR-dependent activation of the transcription factor TIF-IA links rRNA synthesis to nutrient availability.Genes Dev. 2004 Feb 15;18(4):423-34. doi: 10.1101/gad.285504. Genes Dev. 2004. PMID: 15004009 Free PMC article.
-
Ribosome biogenesis and cell growth: mTOR coordinates transcription by all three classes of nuclear RNA polymerases.Oncogene. 2006 Oct 16;25(48):6384-91. doi: 10.1038/sj.onc.1209883. Oncogene. 2006. PMID: 17041624 Review.
-
TIF-IA: An oncogenic target of pre-ribosomal RNA synthesis.Biochim Biophys Acta. 2016 Dec;1866(2):189-196. doi: 10.1016/j.bbcan.2016.09.003. Epub 2016 Sep 15. Biochim Biophys Acta. 2016. PMID: 27641688 Free PMC article. Review.
Cited by
-
Drosophila as a Model Organism to Study Basic Mechanisms of Longevity.Int J Mol Sci. 2022 Sep 24;23(19):11244. doi: 10.3390/ijms231911244. Int J Mol Sci. 2022. PMID: 36232546 Free PMC article. Review.
-
Emerging roles of nucleolar and ribosomal proteins in cancer, development, and aging.Cell Mol Life Sci. 2015 Nov;72(21):4015-25. doi: 10.1007/s00018-015-1984-1. Epub 2015 Jul 24. Cell Mol Life Sci. 2015. PMID: 26206377 Free PMC article. Review.
-
Nutrigenomics in Arma chinensis: transcriptome analysis of Arma chinensis fed on artificial diet and Chinese oak silk moth Antheraea pernyi pupae.PLoS One. 2013 Apr 11;8(4):e60881. doi: 10.1371/journal.pone.0060881. Print 2013. PLoS One. 2013. PMID: 23593338 Free PMC article.
-
The tumor suppressive role of eIF3f and its function in translation inhibition and rRNA degradation.PLoS One. 2012;7(3):e34194. doi: 10.1371/journal.pone.0034194. Epub 2012 Mar 23. PLoS One. 2012. PMID: 22457825 Free PMC article.
-
KDM2A-dependent reduction of rRNA transcription on glucose starvation requires HP1 in cells, including triple-negative breast cancer cells.Oncotarget. 2019 Jul 30;10(46):4743-4760. doi: 10.18632/oncotarget.27092. eCollection 2019 Jul 30. Oncotarget. 2019. PMID: 31413816 Free PMC article.
References
-
- Cavanaugh, A.H., I. Hirschler-Laszkiewicz, Q. Hu, M. Dundr, T. Smink, T. Misteli, and L.I. Rothblum. 2002. Rrn3 phosphorylation is a regulatory checkpoint for ribosome biogenesis. J. Biol. Chem. 277:27423–27432. - PubMed
-
- Claypool, J.A., S.L. French, K. Johzuka, K. Eliason, L. Vu, J.A. Dodd, A.L. Beyer, and M. Nomura. 2004. Tor pathway regulates Rrn3p-dependent recruitment of yeast RNA polymerase I to the promoter but does not participate in alteration of the number of active genes. Mol. Biol. Cell. 15:946–956. - PMC - PubMed
-
- Grewal, S.S., L. Li, A. Orian, R.N. Eisenman, and B.A. Edgar. 2005. Myc- dependent regulation of ribosomal RNA synthesis during Drosophila development. Nat. Cell Biol. 7:295–302. - PubMed
Publication types
MeSH terms
Substances
Grants and funding
LinkOut - more resources
Full Text Sources
Molecular Biology Databases
