. 2007 Dec 17;179(6):1231-45.
doi: 10.1083/jcb.200702031.

Cdk2 is critical for proliferation and self-renewal of neural progenitor cells in the adult subventricular zone

Affiliations

Cdk2 is critical for proliferation and self-renewal of neural progenitor cells in the adult subventricular zone

Beata Jablonska et al. J Cell Biol. .

Abstract

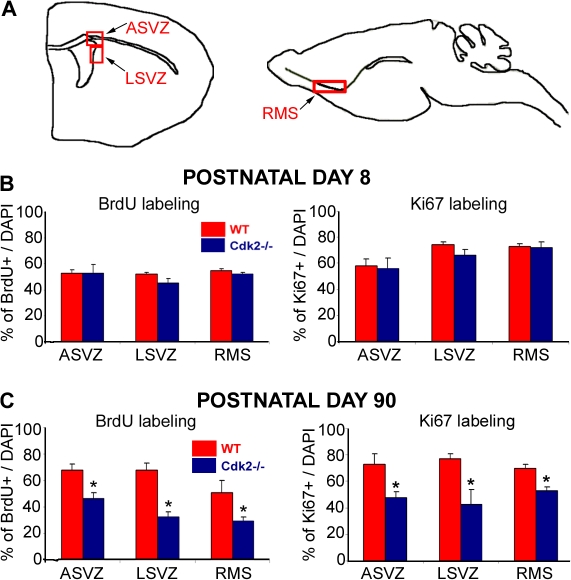
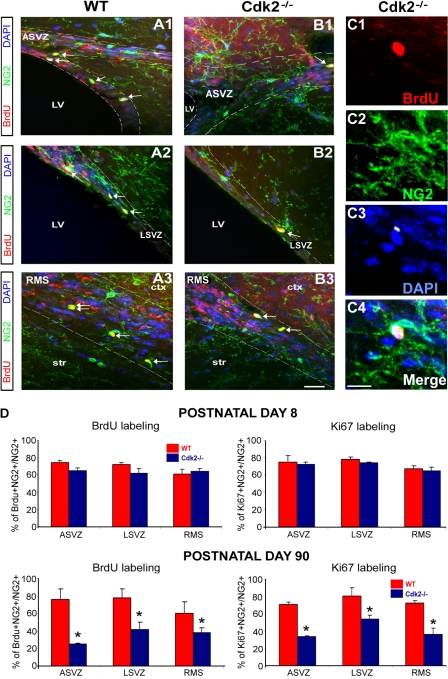
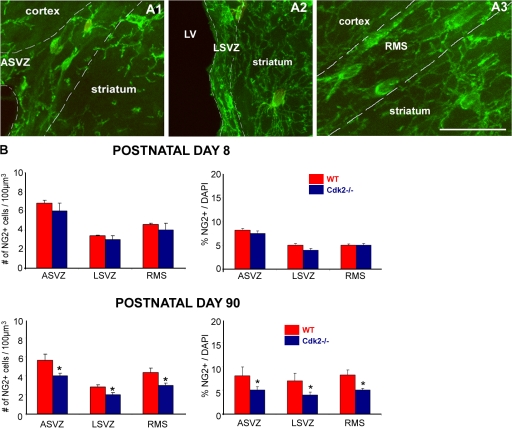
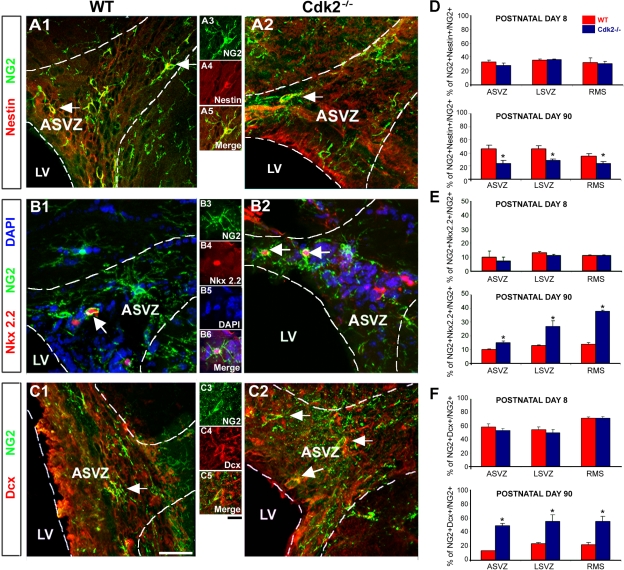
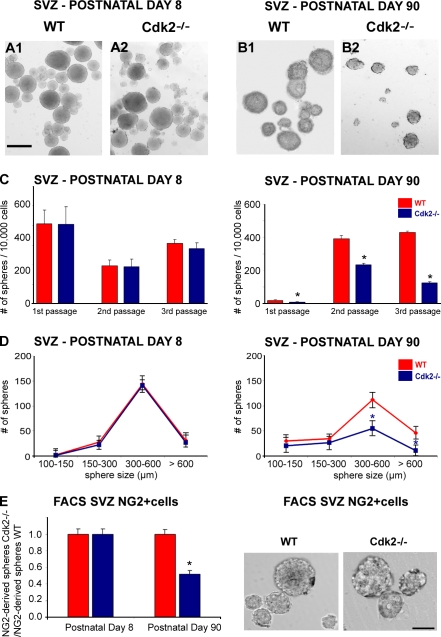
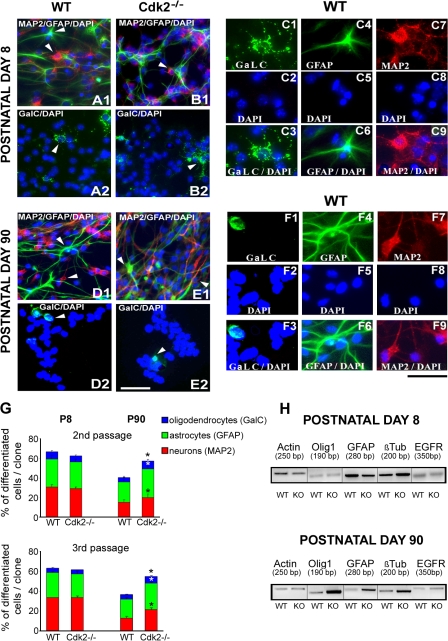
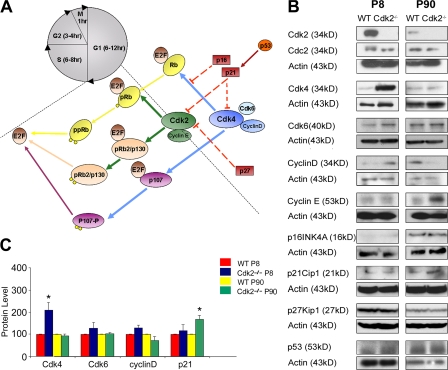
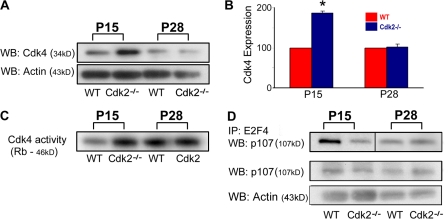
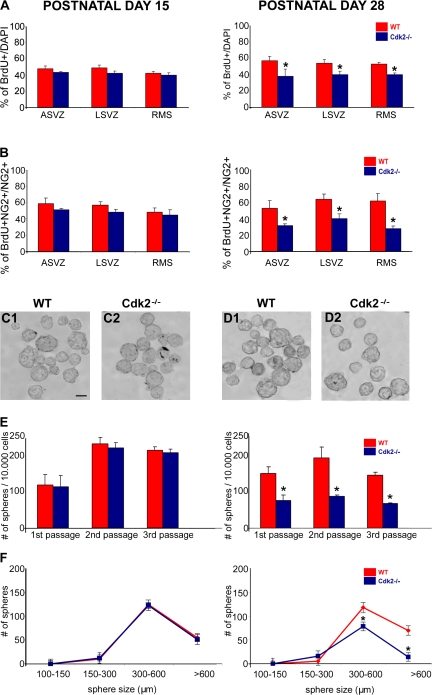
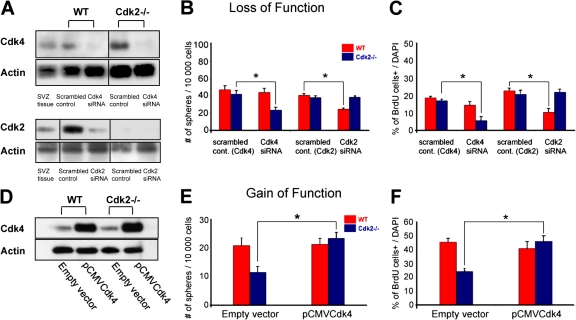
We investigated the function of cyclin-dependent kinase 2 (Cdk2) in neural progenitor cells during postnatal development. Chondroitin sulfate proteoglycan (NG2)-expressing progenitor cells of the subventricular zone (SVZ) show no significant difference in density and proliferation between Cdk2(-/-) and wild-type mice at perinatal ages and are reduced only in adult Cdk2(-/-) mice. Adult Cdk2(-/-) SVZ cells in culture display decreased self-renewal capacity and enhanced differentiation. Compensatory mechanisms in perinatal Cdk2(-/-) SVZ cells, which persist until postnatal day 15, involve increased Cdk4 expression that results in retinoblastoma protein inactivation. A subsequent decline in Cdk4 activity to wild-type levels in postnatal day 28 Cdk2(-/-) cells coincides with lower NG2+ proliferation and self-renewal capacity similar to adult levels. Cdk4 silencing in perinatal Cdk2(-/-) SVZ cells abolishes Cdk4 up-regulation and reduces cell proliferation and self- renewal to adult levels. Conversely, Cdk4 overexpression in adult SVZ cells restores proliferative capacity to wild-type levels. Thus, although Cdk2 is functionally redundant in perinatal SVZ, it is important for adult progenitor cell proliferation and self-renewal through age-dependent regulation of Cdk4.


Figures

Figure 1.
Figure 1.
Loss of Cdk2 causes a reduction of cell proliferation in the SVZ and RMS of the adult brain. (A) Schematic drawings of coronal (left) and sagittal (right) planes of sections showing neurogenic areas of the brain. Proliferating cells were labeled with anti-BrdU and -Ki67 in the ASVZ (left), LSVZ (left), and RMS (right). (B and C) Percentages of proliferating cells were calculated based on the total number of DAPI cells. At P8, the percentages of BrdU+ (left) or Ki67+ (right) cells in the ASVZ, LSVZ, and RMS of the Cdk2−/− mouse were similar to the wild type. At P90, a significant decrease in BrdU+ (left) and Ki67+ (right) cells was observed in all regions of the Cdk2−/− mouse. Results are expressed as means ± the SEM. *, P < 0.05; results were analyzed by a t test (six to eight hemispheres were used for analysis for each age and marker).
Figure 2.
Figure 2.
Decreased proliferation of NG2-expressing progenitors in neurogenic areas of the adult Cdk2−/− mouse. (A–C) Tricolored images show NG2+ progenitor cells (green) in the ASVZ, LSVZ, and RMS (LV, lateral ventricle; ctx, cortex; str, striatum) on sagittal sections obtained from wild-type (A1–3) and Cdk2−/− (B1–3) mice stained with anti-BrdU (red) and DAPI (blue). Arrows indicate proliferating NG2+ progenitors. White dotted lines delineate the ASVZ (A1 and B1), LSVZ (A2 and B2), and RMS (A3 and B3). (C1–4) Cdk2−/− mouse. Magnified view of NG2+ progenitors (C2, anti-NG2) labeled with anti-BrdU (C1) and DAPI (C3). Merged image is shown in C4. (D) Percentages of double-labeled cells. At P8, no differences in the percentage of NG2+–BrdU+ or NG2+–Ki67+ cells were observed in the ASVZ, LSVZ, and RMS between wild-type and Cdk2−/− mice (D, top left and right), whereas at P90 there was a significant reduction in the percentage of proliferating NG2+ cells in the Cdk2−/− brain (D, bottom left and right). Results are expressed as means ± the SEM. *, P < 0.05; results were analyzed by a t test (six to eight hemispheres were taken for analysis for each age and marker). Bars: (A and B) 50 μm; (C) 12 μm.
Figure 3.
Figure 3.
Decreased density of NG2-expressing progenitors in neurogenic areas of the adult Cdk2−/− mouse. (A) NG2+ progenitors present in the ASVZ, LSVZ, and RMS display a migratory cellular morphology as opposed to those in the striatum. White dotted lines delineate the ASVZ (A1), LSVZ (A2), and RMS (A3). Bar, 100 μm. (B) NG2+ progenitor number was estimated as total number of cells per 100 μm3 throughout the entire depth of the sections (left) and as a percentage of total DAPI-labeled cells (right) using confocal z-stack analysis. At P8, no changes in the density and proportion of NG2+ progenitors between the wild type and Cdk2−/− were observed, whereas a significant reduction of NG2+ cell density and proportion was observed at P90 in the ASVZ, LSVZ, and RMS of the Cdk2−/− mouse. Results are expressed as means ± the SEM. *, P < 0.05; results were analyzed by a t test (six to eight hemispheres were taken for analysis for each age and marker).
Figure 4.
Figure 4.
Cdk2 loss promotes lineage specification of adult NG2+ progenitor cells. (A–C) All micrographs were taken from the ASVZ in wild-type and Cdk2−/− mice at P90. Immunostaining shows undifferentiated NG2+–nestin+ progenitors (A1 and 2 and higher magnification in A3–5), Nkx2.2+ oligodendrocyte progenitors (B1 and 2 and higher magnification in B3–6), and Dcx+ neuroblasts (C1 and 2 and higher magnification in C3–5). White dotted lines delineate the ASVZ. (D–F) Histograms represent percentages of NG2+–nestin+, NG2+–Nkx2.2+, and NG2+–Dcx+ cells calculated from the number of total NG2+ cells. At P8, no changes between wild-type and Cdk2−/− mice were observed in the number of NG2+ undifferentiated cells (D, top) as well as oligodendrocyte progenitors (E, top) and neuroblasts (F, top) within the ASVZ, LSVZ, and RMS. In the P90 Cdk2−/− brains, the pool of undifferentiated NG2+ progenitors was partially depleted in the ASVZ, LSVZ, and RMS (D, bottom), whereas a significant increase was observed in the percentage of committed Nkx2.2+ oligodendrocyte progenitors (E, bottom) and Dcx+ postmitotic neuroblasts (F, bottom). Data are expressed as means ± the SEM. *, P < 0.05; results were analyzed by a t test (six to eight hemispheres were taken for analysis for each age and marker). Bars: (A1 and 2, B1 and 2, and C1 and 2) 50 μm; (A3–5, B3–6, and C3–5) 15 μm.
Figure 5.
Figure 5.
The absence of Cdk2 selectively impairs neurosphere formation in adult Cdk2−/−cultures. (A and B) SVZ neurospheres were obtained from single cell suspensions from wild-type and Cdk2−/− mice at P8 (A1 and 2) and P90 (B1 and 2). Bar, 500 μm. (C) To assess self-renewal potential, neurosphere numbers were counted after the first, second, and third passage, respectively. No changes in the number of growing neurospheres were observed in P8 cultures (C, left), whereas a significant decrease of neurosphere growth was observed in P90 Cdk2−/− cultures after each passage (C, right). Data were obtained from three independent experiments and are expressed as means ± the SEM. *, P < 0.05; results were analyzed by a t test. (D) For size analysis, only neurospheres within the range of 100–600 μm were counted. The number of neurospheres bigger than 300 μm was significantly reduced in P90 Cdk2−/− cultures (D, right) but was unaffected in P8 Cdk2−/− cultures (D, left). *, P < 0.05, results were analyzed by a t test. (E) Neurosphere formation from FACS-purified NG2+ SVZ cells (wild type and Cdk2−/−) at P8 and 90. (E, left) At P8, no differences were found in the number of NG2+ cell–derived neurospheres between Cdk2−/− and wild-type cells. Conversely, a significant decrease in the number of neurospheres was found in FACS-sorted NG2+ Cdk2−/− cells at P90 as compared with the wild type. Data were obtained from three independent experiments and are expressed as a ratio between Cdk2−/− and wild-type NG2+ cell–derived neurospheres. All data are expressed as means ± the SEM. *, P < 0.005; results were analyzed by a t test. (E, right) Images of wild-type and Cdk2−/− neurospheres from FACS-sorted P90 NG2+ cells. Bar, 250 μm.
Figure 6.
Figure 6.
Cell differentiation of SVZ progenitors is enhanced by loss of Cdk2. (A–F) Cells plated from SVZ neurospheres obtained from wild-type (A1 and 2 and D1 and 2) and Cdk2−/− (B1 and 2 and E1 and 2) mice differentiated into oligodendrocytes, astrocytes, and neurons as stained with antibodies against GalC, GFAP, and MAP2, respectively. Higher magnification images show the individual cell types at P8 (C1–9) and P90 (F1–9). (G) Comparable percentages of neurons, astrocytes, and oligodendrocytes were obtained from Cdk2−/− and wild-type neurospheres at P8 after second and third passages, but significantly higher percentages of all differentiated cell phenotypes were found in Cdk2−/− cells at P90. Data are expressed as means ± the SEM. *, P < 0.05; results were analyzed using a t test. (H) Semiquantitative RT-PCR analysis confirmed immunolabeling of cells and showed increased levels of oligodendrocyte transcription factor 1 (Olig1), GFAP, and Tubb3 gene expression in P90 Cdk2−/− cells. At P8, no differences in gene expression were observed. Actin and EGFR were used as internal positive controls. Bars: (A, B, D, and E) 50 μm; (C and F) 25 μm.
Figure 7.
Figure 7.
Expression of cell cycle–related proteins is modified in the Cdk2−/− SVZ. (A) Schematic drawing of the major components of the Cdk2 and Cdk4/6 pathways. (B) Western blot analysis shows that at P8, Cdk4, Cdk6, and cyclin D protein levels were elevated in Cdk2−/− SVZ as compared with the wild type. At P90, only p21Cip1 and cyclin E expression were higher in Cdk2−/− than in wild-type SVZ. Actin was used as a loading control. (C) At P8, significant differences were found only for Cdk4 expression, whereas differences in Cdk6 and cyclin D were not significant. At P90, the increase in p21Cip1 expression was significant. Data are expressed as means ± the SEM. *, P < 0.001; results were analyzed by a t test. Each histogram was obtained from the independent Western blot analysis of three to four SVZs.
Figure 8.
Figure 8.
Up-regulation of Cdk4 expression and activity in the Cdk2−/− SVZ decline to adult levels between P15 and 28. (A and B) SVZ tissue lysates were immunoblotted with anti-Cdk4 antibodies and band intensities were measured and normalized to actin. Note that the increase in Cdk4 expression in Cdk2−/− tissue is developmentally regulated and was lost at P28. Each histogram was obtained from an independent Western blot analysis of three to four SVZs. *, P < 0.05; results were analyzed by a t test. (C) Cdk4 activity was up-regulated in Cdk2−/− SVZ at P15 but not P28. Cdk4 activity was measured using glutathione S-transferase Rb protein as a substrate. (D) At P15, E2F4-bound p107 was lower in Cdk2−/− than in wild-type SVZ, which indicates enhanced activation of the Cdk4 pathway. Conversely, at P28, E2F4-bound p107 was similar in Cdk2−/− and wild-type SVZ. E2F4-bound p107 was coimmunoprecipitated with anti-E2F4 antibodies and probed on Western blot with anti-p107 antibodies. Importantly, p107 expression levels did not change at either age in Cdk2−/− versus wild-type SVZ as shown by Western blot with anti-p107 antibodies.
Figure 9.
Figure 9.
Reduction of Cdk4 levels in Cdk2−/− SVZ during postnatal development correlates with a decrease in neural progenitor cell proliferation and self-renewal. (A) BrdU immunolabeling shows that proliferation of total SVZ cells is similar in Cdk2−/− and wild-type brains at P15 (A, left), whereas cell proliferation is significantly decreased in the Cdk2−/− SVZ at P28 (A, right). Similar results were obtained by analyzing NG2+ progenitors at P15 (B, left) and P28 (B, right). Data represent BrdU+ cells as percentages of total DAPI-labeled cells (A1 and 2) or total NG2+ cells (B1 and 2). Data were obtained from at least three separate brains. *, P < 0.001; results were analyzed by a t test. (C–E) Neurosphere numbers were counted after the first, second, and third passage, respectively. No changes in the number of neurospheres were observed in P15 cultures (C1 and 2 and E, left), whereas a significant decreased was observed in P28 Cdk2−/− cultures (D1 and 2 and E, right). Bar, 500 μm. Data were obtained from three independent experiments. (F) For size analysis, only neurospheres within the range of 100–600 μm were counted. The number of neurospheres bigger than 300 μm was significantly reduced in P28 Cdk2−/− cultures but was unaffected in P15 Cdk2−/− cultures. All data are expressed as means ± the SEM. *, P < 0.05; results were analyzed by a t test.
Figure 10.
Figure 10.
siRNA-induced knockdown of Cdk4 and 2 inhibits proliferation in P8 Cdk2−/− and wild-type SVZ cell cultures, respectively. (A–C) Loss- of-function experiments in perinatal SVZ cells. Cells from P8 brains were transfected with scrambled (control), Cdk4-silencing, or Cdk2-silencing siRNA and harvested 24 h after transfection. (A) Cell and SVZ tissue lysates were immunoblotted with anti-Cdk4 and -Cdk2 antibodies and band intensities from siRNA-treated cells were measured and normalized to actin. In both wild-type and Cdk2−/− cells, a reduction of 50–70% in Cdk4 levels was obtained after siRNA transfection. Wild-type P8 SVZ tissue lysate was also used as a positive control for Cdk4 expression. Transfection with Cdk2 siRNA decreased Cdk2 expression in wild-type SVZ cells by ∼50% but did not modify Cdk2 expression in Cdk2−/− P8 SVZ cells. Wild-type P8 SVZ tissue lysate was also used as a positive control for Cdk2 expression. Black lines indicate that the intervening lanes have been spliced out. (B) Transfection of Cdk2−/− cells with scrambled siRNA control did not modify neurosphere formation but Cdk4 siRNA caused a significant decrease in the number of neurospheres. No effect was observed in wild-type cultures. Transfection with Cdk2 siRNA reduced the number of neurospheres in wild-type cultures as compared with treatment with scrambled control. No effect was observed in Cdk2−/− cells. Data were obtained from second passage neurospheres of three independent experiments. (C) BrdU immunolabeling showed that neural progenitor cell proliferation was impaired in Cdk2−/− cultures after Cdk4 siRNA treatment but not in wild-type cultures. After Cdk2 siRNA transfection, proliferation was impaired in wild-type but not Cdk2−/− cultures. Data represent BrdU+ cells as percentages of total DAPI-labeled cells and were obtained from three separate experiments (three independent cell cultures). The total number of cells counted was 454 (scrambled control Cdk4), 782 (scrambled control Cdk2), 458 (Cdk4 siRNA), and 636 (Cdk2 siRNA) for the wild type; and 647 (scrambled control Cdk4), 765 (scrambled control Cdk2), 624 (Cdk4 siRNA), and 643 (Cdk2 siRNA) for Cdk2−/−. (D–F) Gain-of-function experiments in adult SVZ cells. Plasmid pCMV-Cdk4 and empty vector were transfected to P90 wild-type and Cdk2−/− cells. (D) Western blot analysis shows higher Cdk4 expression in both wild-type and Cdk2−/− SVZ cells after transfection with pCMV-Cdk4 as compared with transfection with an empty vector. (E) Transfection of Cdk2−/− cells with pCMV-Cdk4 caused a significant increase in the number of neurospheres compared with wild-type cells. Data were obtained from second passage neurospheres of three independent experiments. (F) BrdU incorporation assays. Cdk4 overexpression did not modify cell proliferation in wild-type cells but greatly increased cell proliferation in Cdk2−/− cells to levels similar to the wild type. Data were obtained from three independent experiments. The total number of cells counted was 511 and 451 for the empty vector (wild type and Cdk2−/−, respectively) and 425 and 608 for pCMV-Cdk4 (wild type and Cdk2−/−, respectively). Data are expressed as means ± the SEM. *, P < 0.05; results were analyzed by a t-test.

Similar articles

Cited by

References

    1. Aguirre, A., and V. Gallo. 2004. Postnatal neurogenesis and gliogenesis in the olfactory bulb from NG2-expressing progenitors of the subventricular zone. J. Neurosci. 24:10530–10541. - PMC - PubMed
    1. Aguirre, A.A., R. Chittajallu, S. Belachew, and V. Gallo. 2004. NG2-expressing cells in the subventricular zone are type C–like cells and contribute to interneuron generation in the postnatal hippocampus. J. Cell Biol. 165:575–589. - PMC - PubMed
    1. Aguirre, A., T.A. Rizvi, N. Ratner, and V. Gallo. 2005. Overexpression of the epidermal growth factor receptor confers migratory properties to nonmigratory postnatal neural progenitors. J. Neurosci. 25:11092–11106. - PMC - PubMed
    1. Anton, E.S., H.T. Ghashghaei, J.L. Weber, C. McCann, T.M. Fischer, I.D. Cheung, M. Gassmann, A. Messing, R. Klein, M.H. Schwab, et al. 2004. Receptor tyrosine kinase ErbB4 modulates neuroblast migration and placement in the adult forebrain. Nat. Neurosci. 7:1319–1328. - PubMed
    1. Beijersbergen, R.L., L. Carlee, R.M. Kerkhoven, and R. Bernards. 1995. Regulation of the retinoblastoma protein-related p107 by G1 cyclin complexes. Genes Dev. 9:1340–1353. - PubMed

Publication types

MeSH terms