

Recent acceleration of human adaptive evolution
- PMID: 18087044
- PMCID: PMC2410101
- DOI: 10.1073/pnas.0707650104
Recent acceleration of human adaptive evolution
Abstract
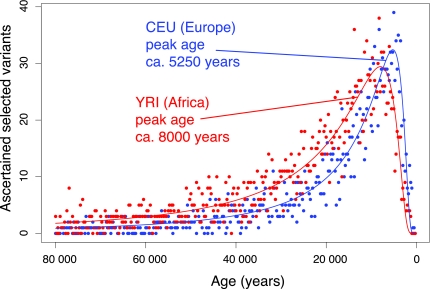
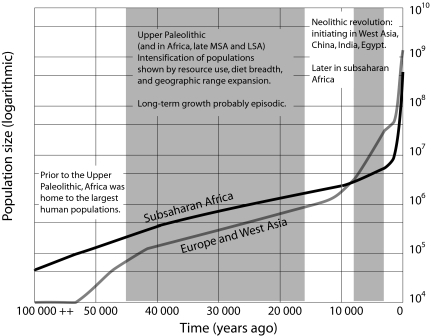
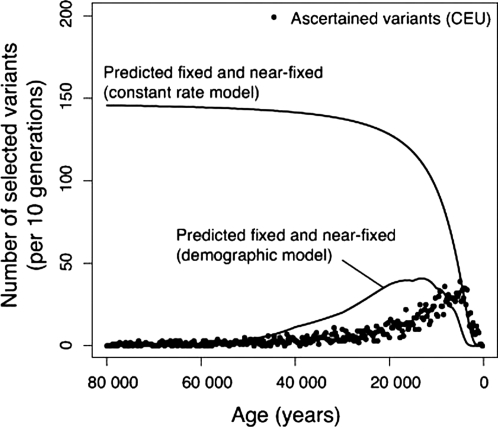
Genomic surveys in humans identify a large amount of recent positive selection. Using the 3.9-million HapMap SNP dataset, we found that selection has accelerated greatly during the last 40,000 years. We tested the null hypothesis that the observed age distribution of recent positively selected linkage blocks is consistent with a constant rate of adaptive substitution during human evolution. We show that a constant rate high enough to explain the number of recently selected variants would predict (i) site heterozygosity at least 10-fold lower than is observed in humans, (ii) a strong relationship of heterozygosity and local recombination rate, which is not observed in humans, (iii) an implausibly high number of adaptive substitutions between humans and chimpanzees, and (iv) nearly 100 times the observed number of high-frequency linkage disequilibrium blocks. Larger populations generate more new selected mutations, and we show the consistency of the observed data with the historical pattern of human population growth. We consider human demographic growth to be linked with past changes in human cultures and ecologies. Both processes have contributed to the extraordinarily rapid recent genetic evolution of our species.
Conflict of interest statement
The authors declare no conflict of interest.
Figures
References
-
- Biraben J-N. Population Sociétés. 2003;394:1–4.
-
- Fisher RA. The Genetical Theory of Natural Selection. Oxford: Clarendon; 1930.
-
- Roush RT, McKenzie JA. Annu Rev Entomol. 1987;32:361–380. - PubMed
Publication types
MeSH terms
LinkOut - more resources
Full Text Sources
Other Literature Sources
Miscellaneous
