Meta-Analysis
. 2007 Dec 18:7:226.
doi: 10.1186/1471-2407-7-226.

Genomic imbalances in 5918 malignant epithelial tumors: an explorative meta-analysis of chromosomal CGH data

Affiliations
Meta-Analysis

Genomic imbalances in 5918 malignant epithelial tumors: an explorative meta-analysis of chromosomal CGH data

Michael Baudis. BMC Cancer. .

Abstract

Background: Chromosomal abnormalities have been associated with most human malignancies, with gains and losses on some genomic regions associated with particular entities.

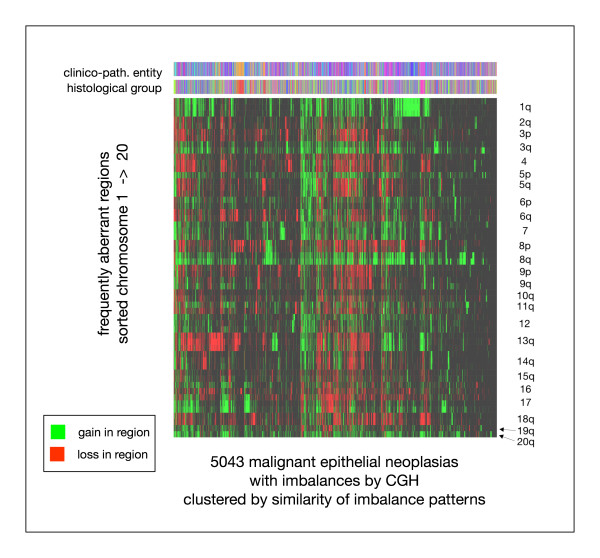
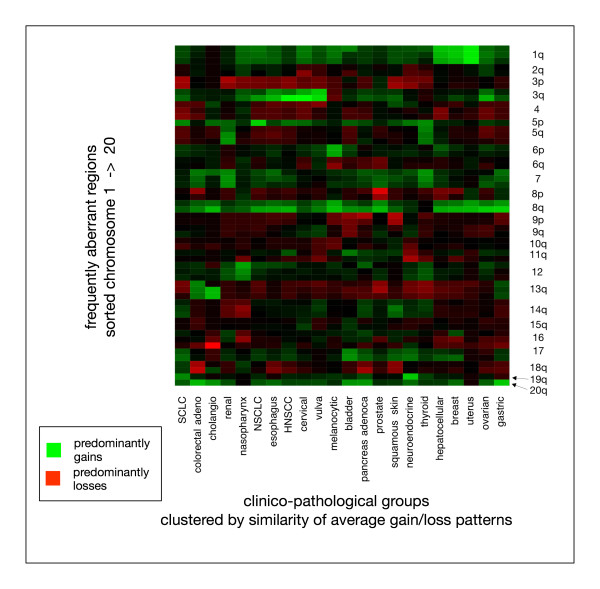
Methods: Of the 15429 cases collected for the Progenetix molecular-cytogenetic database, 5918 malignant epithelial neoplasias analyzed by chromosomal Comparative Genomic Hybridization (CGH) were selected for further evaluation. For the 22 clinico-pathological entities with more than 50 cases, summary profiles for genomic imbalances were generated from case specific data and analyzed.

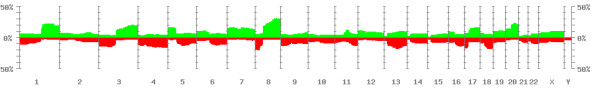
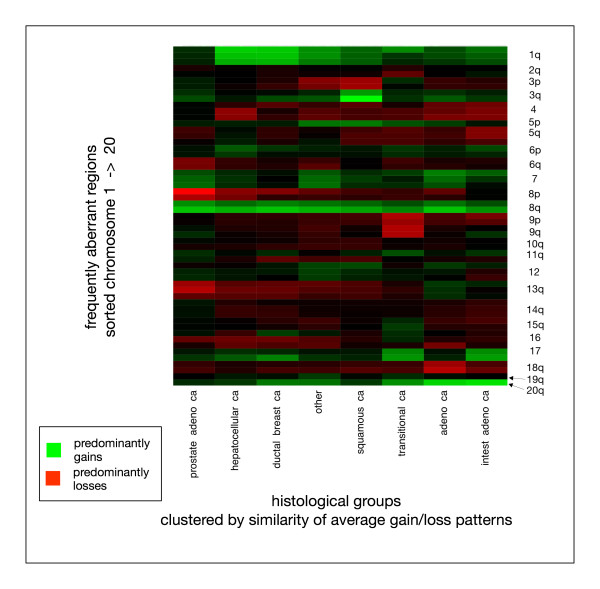
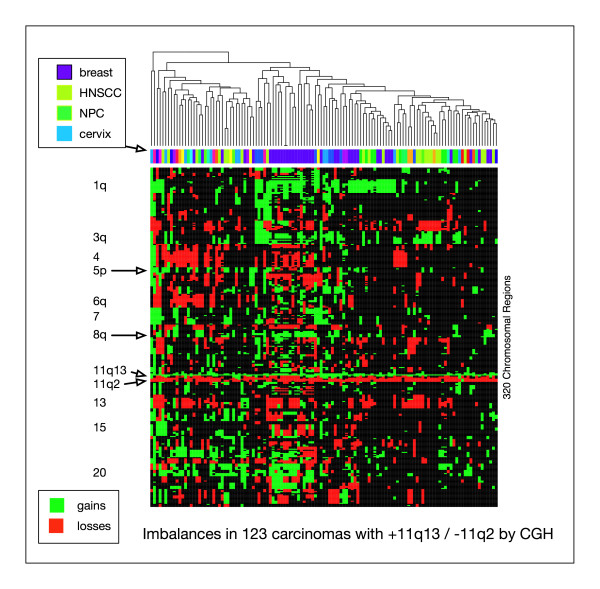
Results: With large variation in overall genomic instability, recurring genomic gains and losses were prominent. Most entities showed frequent gains involving 8q2, while gains on 20q, 1q, 3q, 5p, 7q and 17q were frequent in different entities. Loss "hot spots" included 3p, 4q, 13q, 17p and 18q among others. Related average imbalance patterns were found for clinically distinct entities, e.g. hepatocellular carcinomas (ca.) and ductal breast ca., as well as for histologically related entities (squamous cell ca. of different sites).

Conclusion: Although considerable case-by-case variation of genomic profiles can be found by CGH in epithelial malignancies, a limited set of variously combined chromosomal imbalances may be typical for carcinogenesis. Focus on the respective regions should aid in target gene detection and pathway deduction.


Figures

Figure 1
Figure 1
Number of imbalanced chromosomes for different tumor loci as indicator for overall genomic instability, in 5918 malignant epithelial tumors. The box plots indicate the median and distribution of chromosomes in each tumor karyotype, with total or partial genomic imbalances. Only malignant cases (ICD-code ####/2 or ####/3) were analyzed.
Figure 2
Figure 2
Overall imbalance pattern from all cases. For each chromosomal band (862 bands resolution) the percentage of cases with gains (green, upward) and losses (red, downward) is indicated.
Figure 3
Figure 3
Clustering of 5043 malignant epithelial neoplasias by the pattern of gains and losses, using regions previously defined as highly aberrant in one or several entities (ref. tables 2 + 3). For each case (x-axis), gains (green) and losses (red) are indicated for the corresponding chromosomal regions (55 selected bands; y-axis). The color bar codes on top indicate the cases' assignments to the different clinico-pathological entities and histological groups (color code is provided in the additional file 1).
Figure 4
Figure 4
Clustering of carcinoma entities by their overall imbalance pattern. For each of the selected chromosomal regions, aberrations were summarized (percent gain – percent loss). After normalization of all regions over the respective entity, the color intensities represent the relative contribution of regional gains and losses to the overall aberration patterns.
Figure 5
Figure 5
Clustering of different histologies in carcinomas by their overall imbalance pattern. Here, the most frequent histological types were automatically grouped for their overall imbalance profiles. Since considerable differences had been found for adenocarcinoma cases from the prostate (most notably lack of 1q gains), this group was separeted from the overall adenocarcinoma group.
Figure 6
Figure 6
Visualization of single case aberration patterns in 123 carcinomas with gain on 11q13 and concomitant proximal loss. Cases are clustered according to their imbalance patterns (gain/loss status, 320 bands resolution).

Similar articles

Cited by

References

    1. Patau K. The identification of individual chromosomes, especially in man. Am J Hum Genet. 1960;12:250–276. - PMC - PubMed
    1. Crossen PE. Giemsa banding patterns of human chromosomes. Clin Genet. 1972;3:169–179. - PubMed
    1. Speicher MR, Gwyn Ballard S, Ward DC. Karyotyping human chromosomes by combinatorial multi-fluor FISH. Nat Genet. 1996;12:368–375. doi: 10.1038/ng0496-368. - DOI - PubMed
    1. Veldman T, Vignon C, Schrock E, Rowley JD, Ried T. Hidden chromosome abnormalities in haematological malignancies detected by multicolour spectral karyotyping. Nat Genet. 1997;15:406–410. doi: 10.1038/ng0497-406. - DOI - PubMed
    1. Cremer T, Lichter P, Borden J, Ward DC, Manuelidis L. Detection of chromosome aberrations in metaphase and interphase tumor cells by in situ hybridization using chromosome-specific library probes. Hum Genet. 1988;80:235–246. doi: 10.1007/BF01790091. - DOI - PubMed

Publication types

LinkOut - more resources