. 2008 Jan;29(1):3-19.
doi: 10.1097/AUD.0b013e31815d63a5.

Clinical utility of laser-Doppler vibrometer measurements in live normal and pathologic human ears

Affiliations

Clinical utility of laser-Doppler vibrometer measurements in live normal and pathologic human ears

John J Rosowski et al. Ear Hear. 2008 Jan.

Abstract

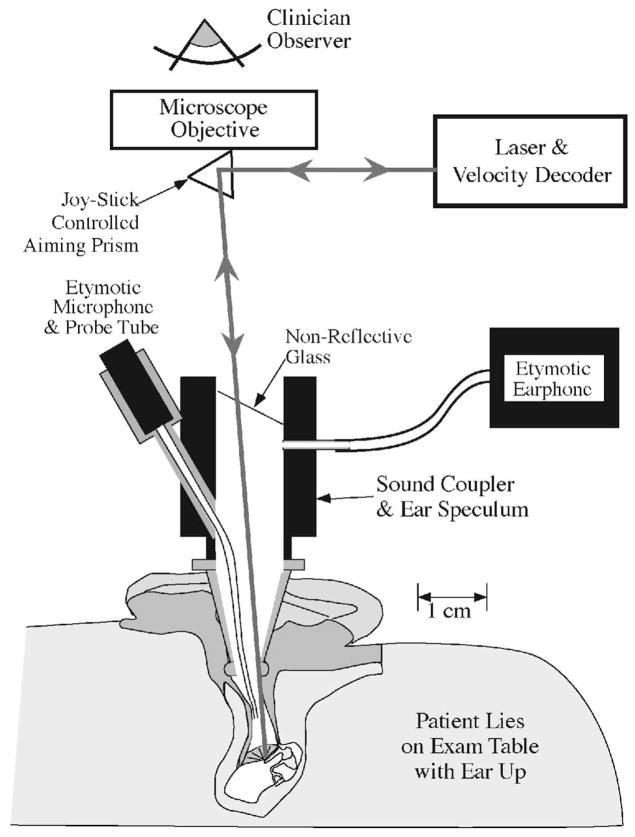
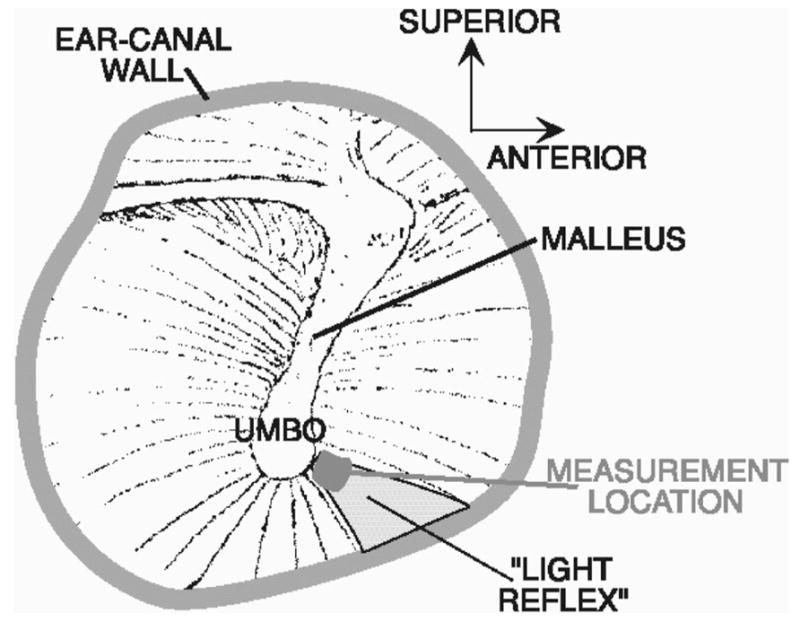
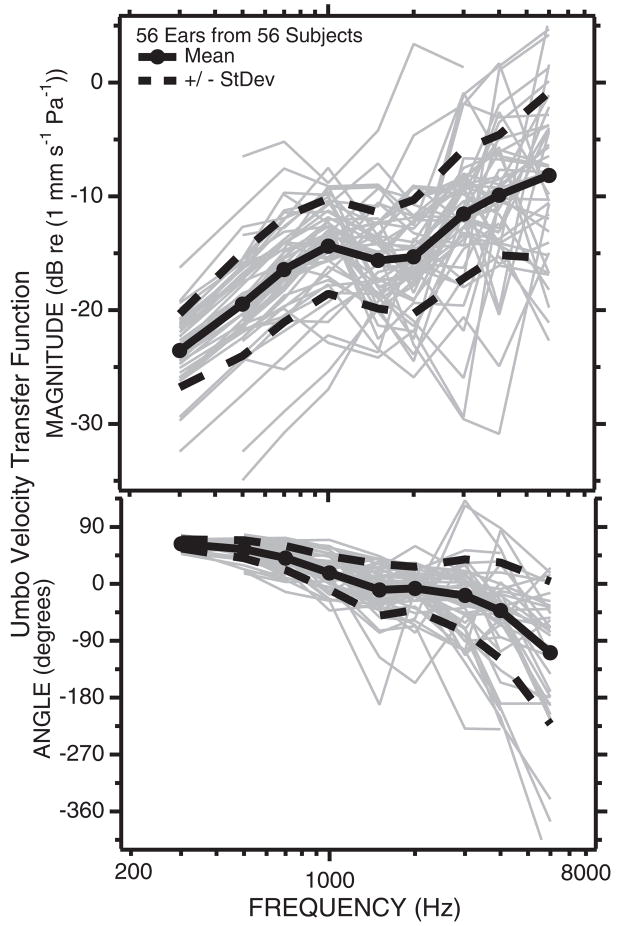
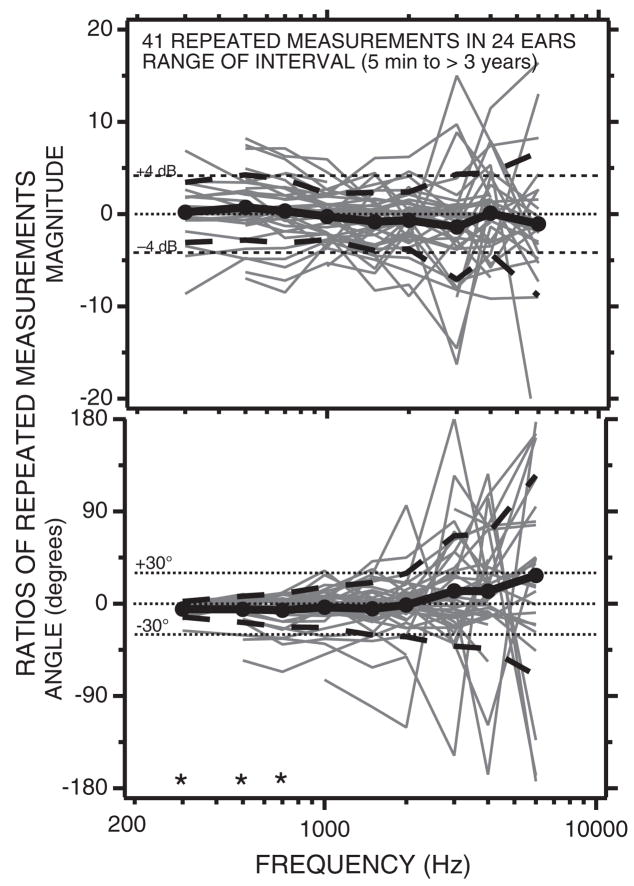
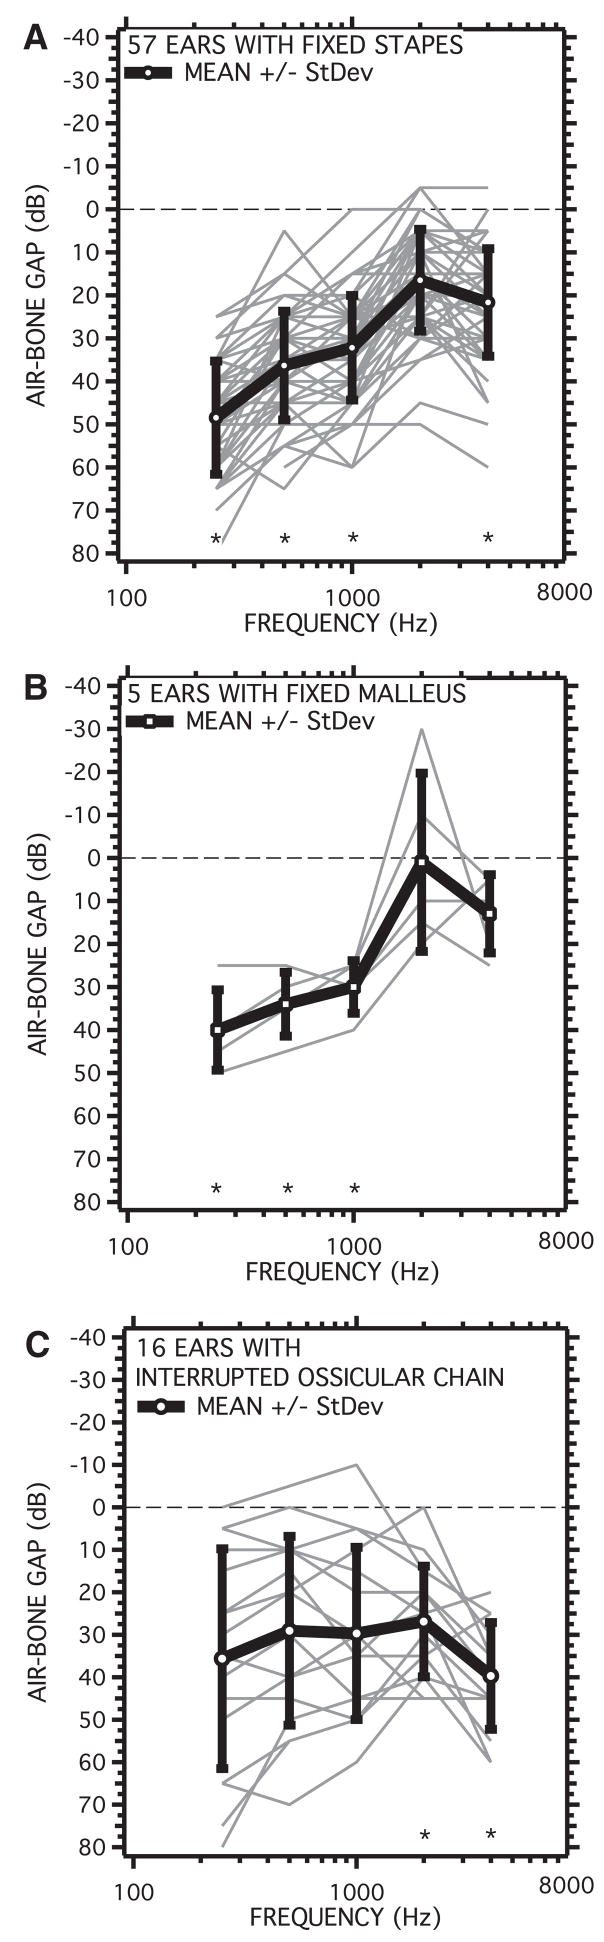
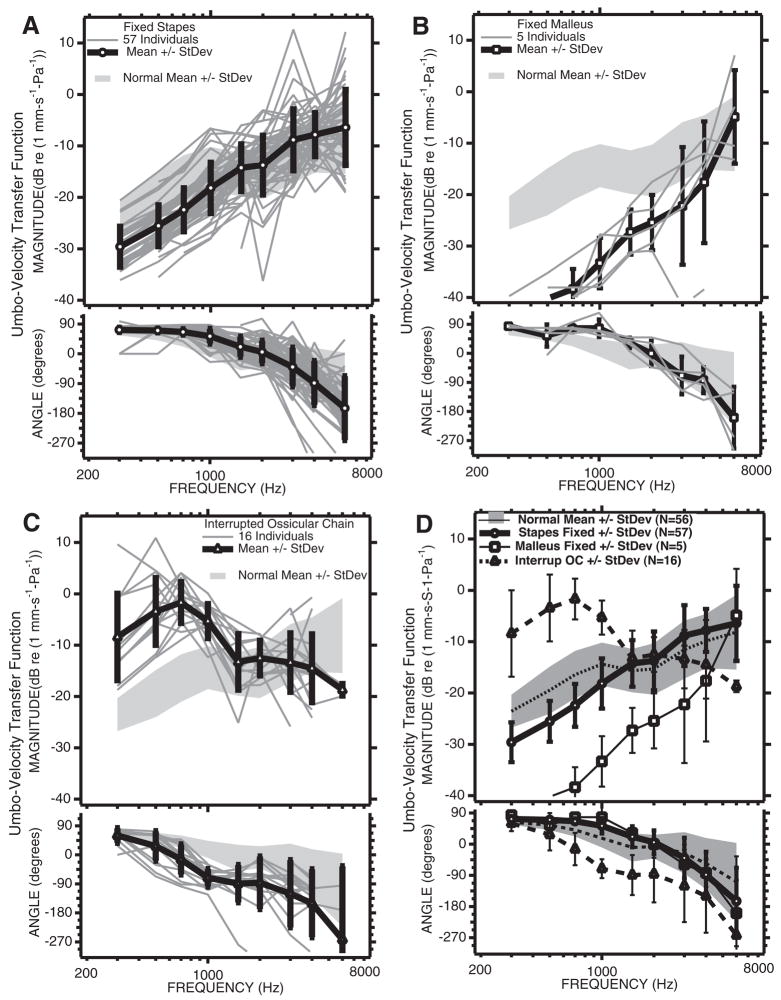
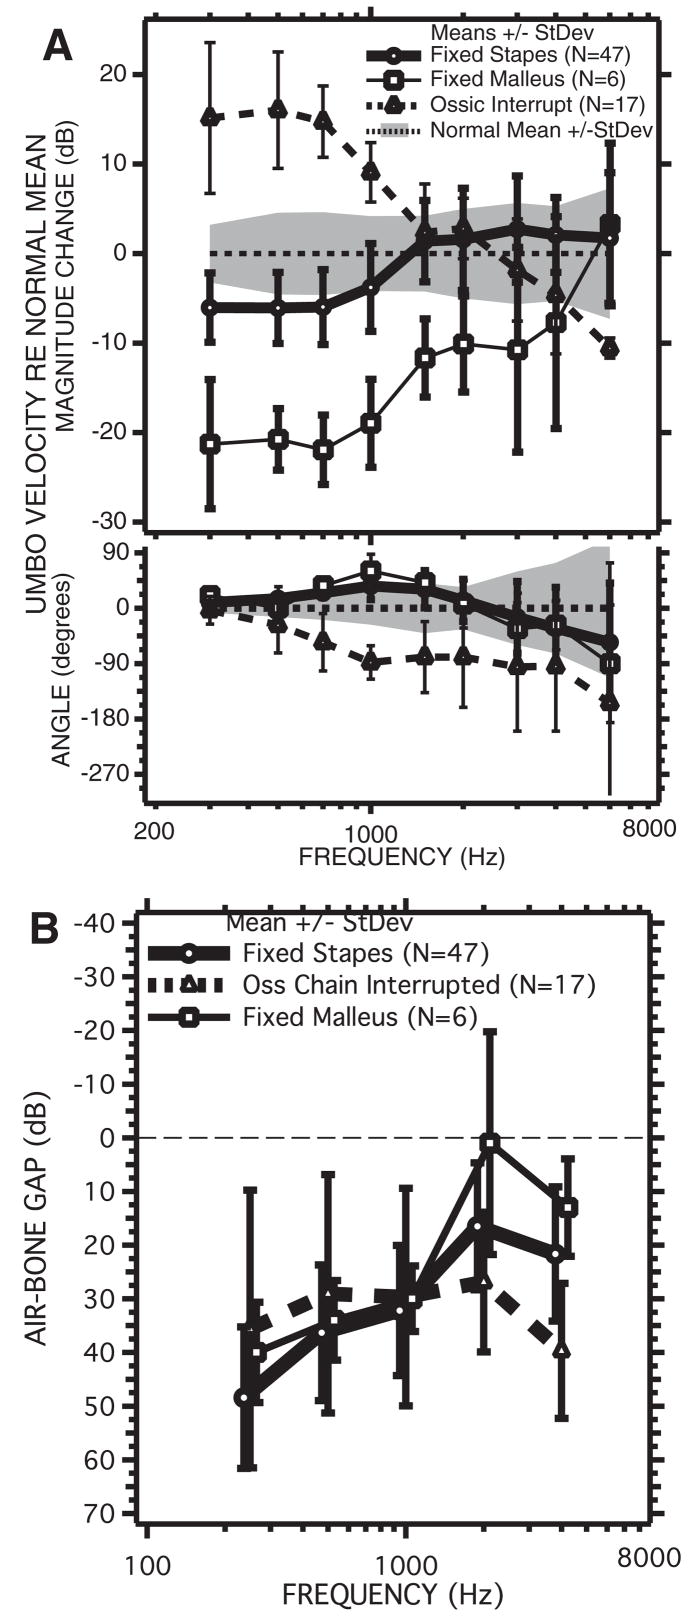
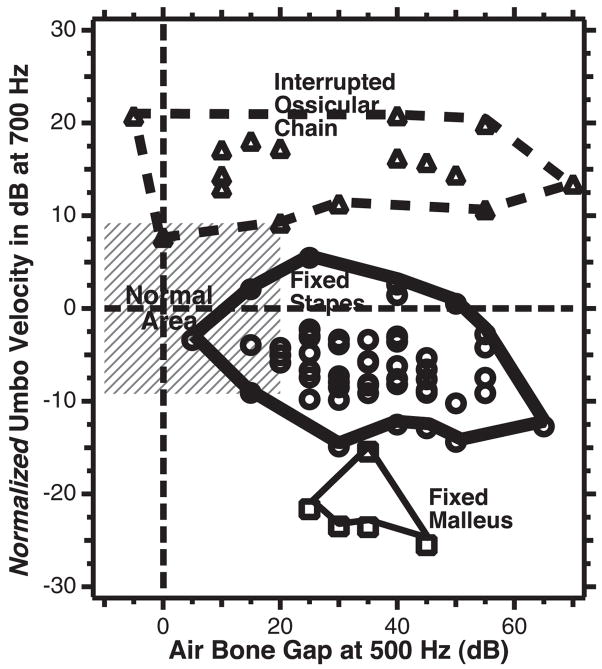
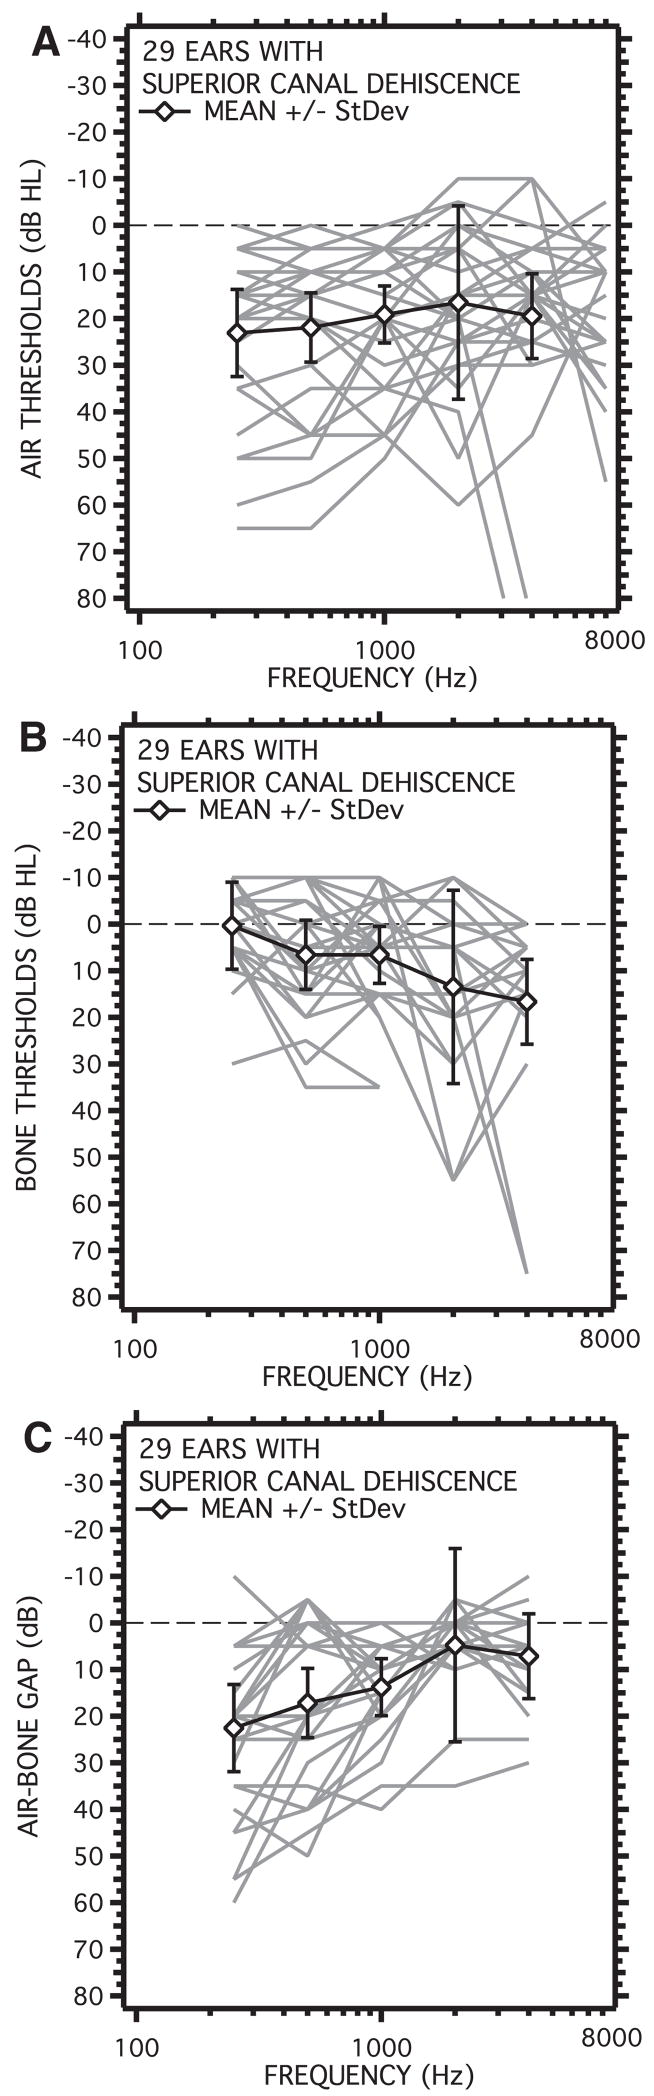
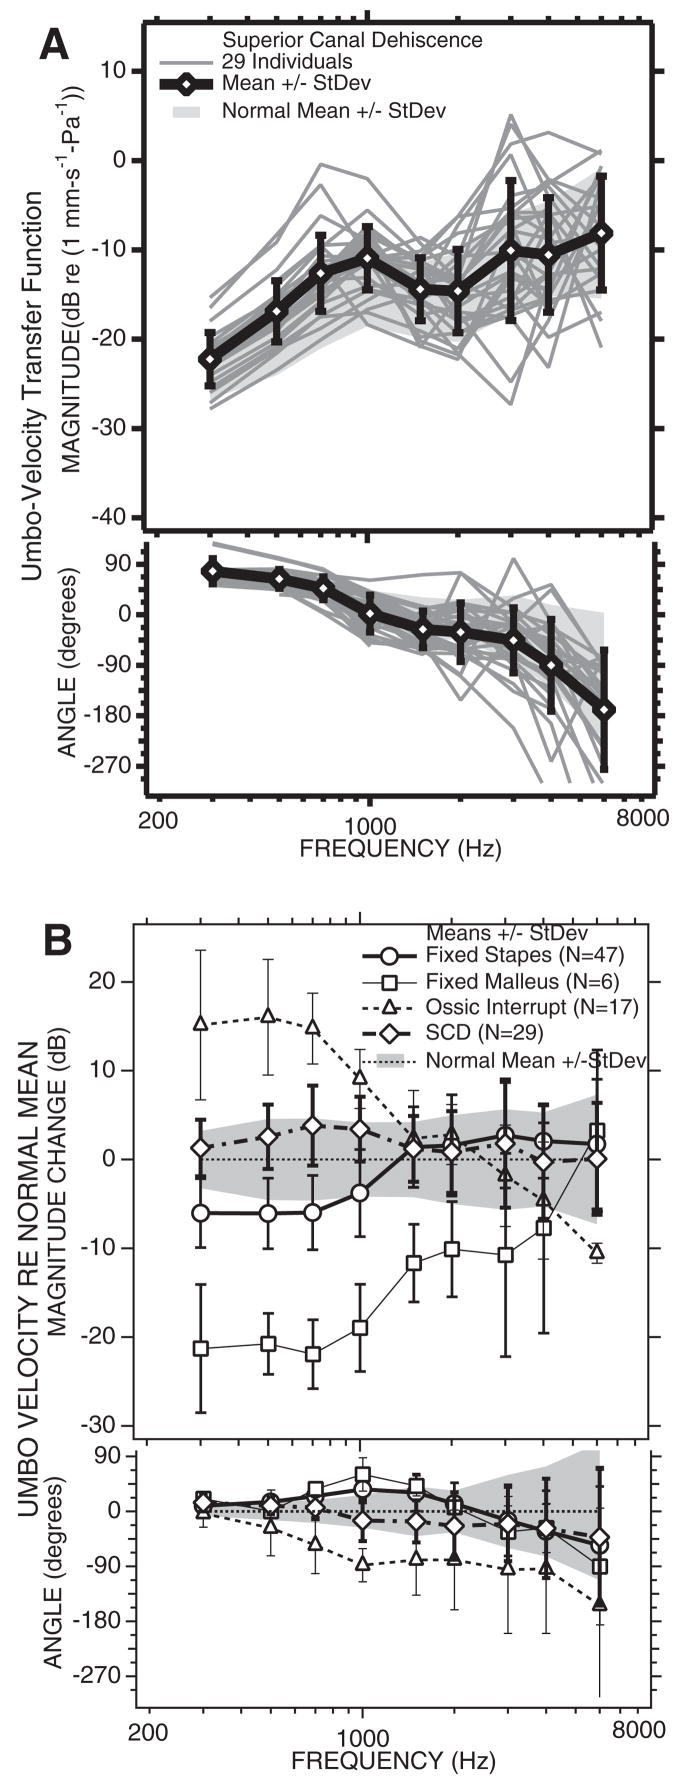
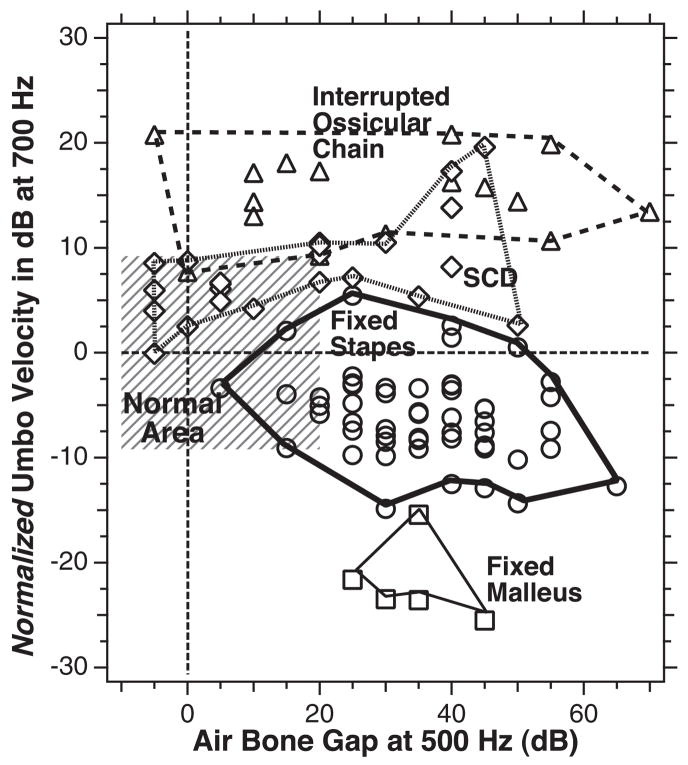
The laser-Doppler vibrometer (LDV) is a research tool that can be used to quickly measure the sound-induced velocity of the tympanic membrane near the umbo (the inferior tip of the malleus) in live human subjects and patients. In this manuscript we demonstrate the LDV to be a sensitive and selective tool for the diagnosis and differentiation of various ossicular disorders in patients with intact tympanic membranes and aerated middle ears. Patients with partial or total ossicular interruption or malleus fixation are readily separated from normal-hearing subjects with the LDV. The combination of LDV measurements and air-bone gap can distinguish patients with fixed stapes from those with normal ears. LDV measurements can also help differentiate air-bone gaps produced by ossicular pathologies from those associated with pathologies of inner-ear sound conduction such as a superior semicircular canal dehiscence.


Figures

Fig. 1
Fig. 1
Laser Doppler vibrometry methods (after Whittemore, Merchant, Poon, & Rosowski, 2004). The patient lies supine on an examination table with the ear turned up. A speculum and operating microscope are used to examine the ear and observe the umbo of the malleus. A glass-backed sound coupler with attached microphone and earphone is attached to the speculum and the beam of the laser is focused through the glass onto the TM with the aid of a joystick-controlled prism. The light reflected from the TM travels back to the laser’s velocity decoder via the same optical path. A comparison of the frequencies of the transmitted and reflected light allows computation of the velocity of oscillation of the sound-driven TM.
Fig. 2
Fig. 2
Focusing the laser in the bright “light-reflex” area near the umbo of the malleus in a right ear.
Fig. 3
Fig. 3
The umbo-velocity transfer function in 56 normally hearing ears. The gray lines are individual measurements of the dB magnitude (upper panel) and angle in degrees (lower panel) of a transfer function from one normally hearing ear in 56 subjects with at least one normal ear. Also illustrated are the means (filled circles and solid black lines) ± the standard deviations (dashed black lines) for the population. The ±6 dB standard deviation range in magnitude suggest that 66% of normal ears fall into a velocity range of the mean ± 6 dB. The standard deviation of the phase angle depends on stimulus frequency and increases as frequency increases (after Whittemore, Merchant, Poon, & Rosowski, 2004).
Fig. 4
Fig. 4
The magnitude (in dB) and angle of 41 ratios of repeated and initial LDV measurements made in 24 ears. A magnitude of 0 dB and an angle of 0 are indicative of perfect repeatability. The filled circles and the thick solid black lines illustrate the mean magnitude and angle of the 41 repetitions. The thick black dashed lines are ±1 standard deviation around the mean. The mean magnitudes are not significantly different from 0 dB. The mean angles at 300, 500, and 700 (labeled with *) were shown by one-tailed Student t test to be significantly different from 0 at the p < 5% level. (After Whittemore, Merchant, Poon, & Rosowski, 2004.)
Fig. 5
Fig. 5
The ratio of velocity measured with nonzero middle ear pressure and the velocity measured with 0 middle ear pressure. The stimulus is a 500 Hz tone. The velocity ratio decreases as a hyperbolic function with pressure as is predicted by a middle ear compliance that is inversely proportional to static pressure. A ratio of 0.3 is equivalent to a 10 dB reduction in velocity.
Fig. 6
Fig. 6
Comparisons of the mean and 95% confidence limits of the mean of the umbo-velocity transfer function measured in 56 ears with normal hearing and 47 ears with sensorineural hearing loss. The dB values of the magnitudes are illustrated in the upper panel. The comparison of the angles is in the lower panel (after Whittemore, Merchant, Poon, & Rosowski, 2004). The differences observed in magnitude are not significant at the 5% level. The differences in angle at 1000 and 1500 Hz are significant at the p < 5%.
Fig. 7
Fig. 7
A plot of the magnitude of the umbo-velocity transfer function at 6000 Hz vs. age in normal hearing ears (the filled circles) and ears with sensorineural hearing loss (the open circles). The correlation between the velocities and age (R = 0.24) is significant at the p = 5% level. The slope of the regression line suggests an increase in velocity of 1 dB with every 7.7 years of age (After Whittemore, Merchant, Poon, & Rosowski, 2004).
Fig. 8
Fig. 8
Air-bone gaps measured in patients with surgically confirmed ossicular disorders. Measurements in individual ears are illustrated with thin gray lines. The mean at each frequency is shown by the symbols and thick black lines. The bars represent the standard deviation. The plotting format is similar to an audiogram with larger gaps and poorer hearing plotted below the origin. A, The air-bone gap in 57 ears with stapes fixation. B, The air-bone gap in five ears with fixed malleus. C, The air-bone gap in 16 ears with either partial or total interruption of the ossicular chain. The points labeled by an * where shown by one-tailed Student t test to be significantly different (p < 5%) from zero.
Fig. 9
Fig. 9
Comparisons of the individuals and means and standard deviations of the LDV measurements from the three groups of patients with ossicular disorders with the mean and standard deviation of the normal population. A, LDV Measurements from 57 ears with surgically confirmed fixed stapes. B, LDV measurements from five ears with fixed malleus. C, LDV measurements from 16 ears with partial or total ossicular interruption. D, Comparisons of the means and standard deviations from the three pathological groups with the mean and standard deviation of the normal group.
Fig. 10
Fig. 10
The mean changes in umbo-velocity transfer function and air-bone gap associated with the three ossicular pathologies: fixed-stapes (circles), fixed-malleus (squares), and ossicular-interruption (triangles). A, The mean changes in velocity relative to the mean normal velocity magnitude and phase for the three conditions. The shaded areas represent the range covered by ±1 standard deviation around the normal mean. The bars represent ±1 standard deviation around the means of the magnitude and angles for the three pathologies. There is a clear separation of velocity magnitudes in the three pathologies at frequencies less than 1500 kHz. B, The mean air-bone gaps ± 1 standard deviations for the three ossicular pathologies. The standard deviations of the air-bone gaps, at frequencies of 1000 Hz and less, overlap in the three pathologies.
Fig. 11
Fig. 11
A plot of normalized umbo velocity (the difference in umbo-velocity transfer-function magnitude from the mean normal value) at 700 Hz on the ordinate scale vs. the air-bone gap at 500 Hz for each of the individual ears in the three groups of ossicular disorders: Fixed-stapes ear data are shown as circles, fixed malleus as squares, and ossicular interruption as triangles. The thin dashed horizontal line marks the contour associated with mean normal umbo velocity. The thin dashed vertical line demarcates the contour associated with a 0 dB air-bone gap. The gray area outlines the region of air-bone gap less than 20 dB and an umbo velocity that is within two standard deviations of normal. The thicker lines are used to circumscribe the results from the three ossicular disorders.
Fig. 12
Fig. 12
Audiometric results from 29 ears of 22 patients diagnosed with SCD. A, Mean and individual air-conduction audiograms. B, Mean and individual bone-conduction audiograms. C, Mean and individual air-bone gaps. Only 66% of the ears had air-bone gaps that were 20 dB or larger at one or more frequencies. Because of the limitations in test equipment, bone thresholds lower than −10 dB could not be measured.
Fig. 13
Fig. 13
LDV results from 29 ears with SCD. A, The umbo-velocity transfer-function magnitude (upper panel) and angle (lower panel). The mean is plotted as open diamond and thick lines. The cross bars represent ±1 standard deviation. The gray-shaded region is the normal mean ±1 standard deviation. B, The mean difference in umbo velocity from normal in: 29 ears with SCD, the line with longer dashes and open diamonds; 47 ears with fixed stapes, the open circles, and solid lines; 5 ears with fixed malleus, the squares, and the thinner solid line; 17 ears with ossicular interruption, the triangles, and the dashed line. The bars represent ±1 standard deviation.
Fig. 14
Fig. 14
Twenty-nine cases with SCD can generally be separated from stapes fixation in the velocity vs. air-bone gap plane. A criterion velocity level of greater than or equal to the mean normal velocity will wrongly identify 10% of the fixed-stapes cases as SCD and miss one (4%) of the SCD cases.

References

    1. Allen JB. Measurements of eardrum acoustic impedance. In: Allen JB, Hall JL, Hubbard A, Neely ST, Tubis A, editors. Peripheral auditory mechanisms. New York: Springer-Verlag; 1986. pp. 44–51.
    1. Brantberg K, Bergenius J, Mendel L, Witt H, Tribukait A, Ygge J. Symptoms, findings and treatment in patients with dehiscence of the superior semicircular canal. Acta Otolaryngologica. 2001;121:68–75. - PubMed
    1. Brantberg K, Löfqvist L, Fransson PA. Large vestibular evoked myogenic potentials in response to bone-conducted sound in patients with superior canal dehiscence syndrome. Audiology and Neuro-Otology. 2004;9:173–182. - PubMed
    1. Carhart R. Bone conduction advances following fenestration surgery. Transactions of the American Academy of Opthamology and Otolaryngology. 1952;56:621–629. - PubMed
    1. Chien W, Ravicz ME, Rosowski JJ, Merchant SN. Measurements of human middle- and inner-ear mechanics with dehiscence of the superior semicircular canal. Otology & Neurotology. 2007;28:250–257. - PMC - PubMed

Publication types