. 2008 Apr;18(2):180-97.
doi: 10.1111/j.1750-3639.2007.00113.x. Epub 2007 Dec 17.

Neurogenesis impairment and increased cell death reduce total neuron number in the hippocampal region of fetuses with Down syndrome

Affiliations

Neurogenesis impairment and increased cell death reduce total neuron number in the hippocampal region of fetuses with Down syndrome

Sandra Guidi et al. Brain Pathol. 2008 Apr.

Abstract

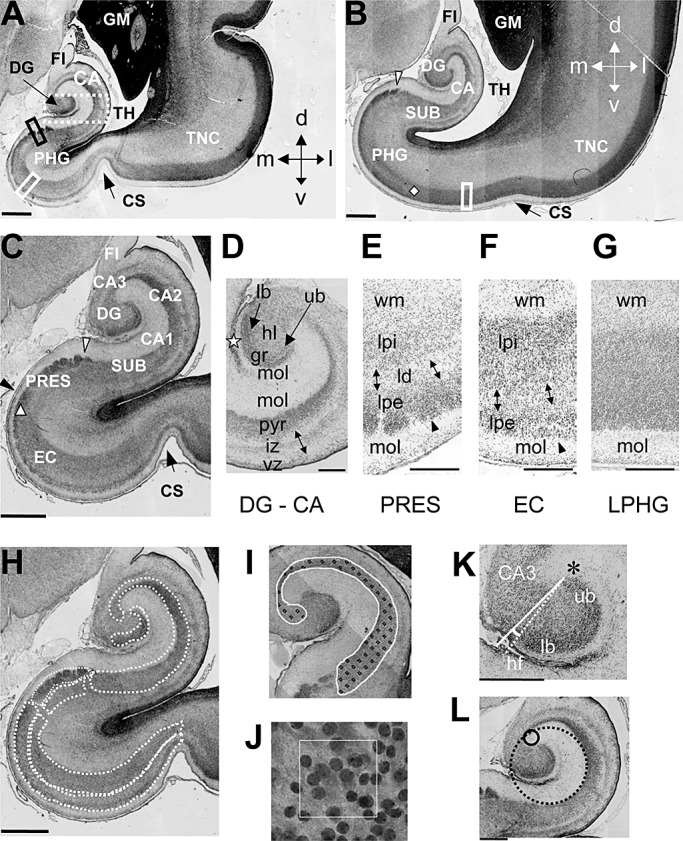
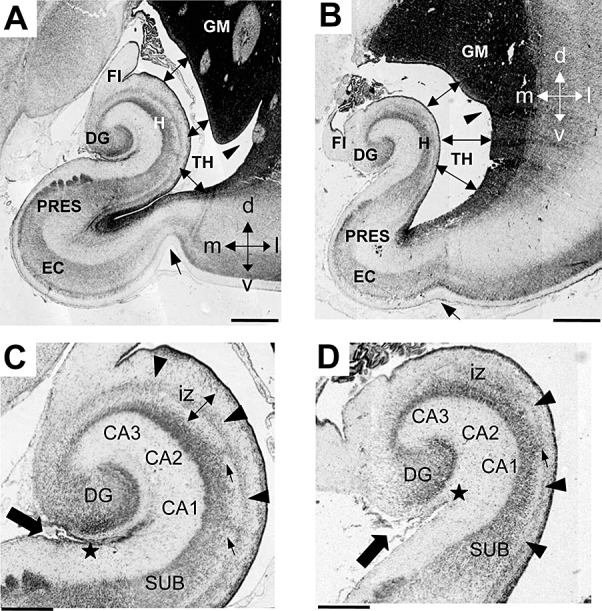
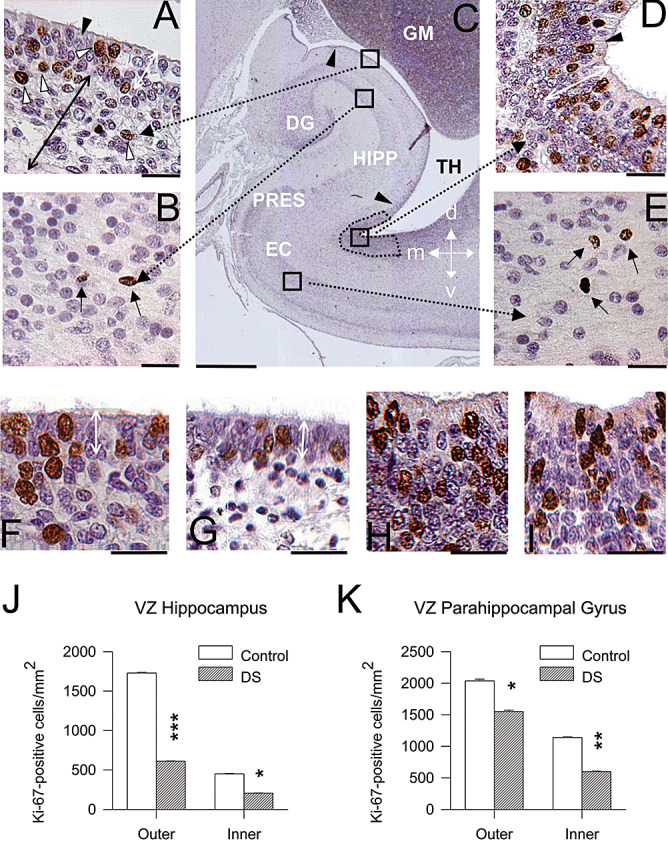
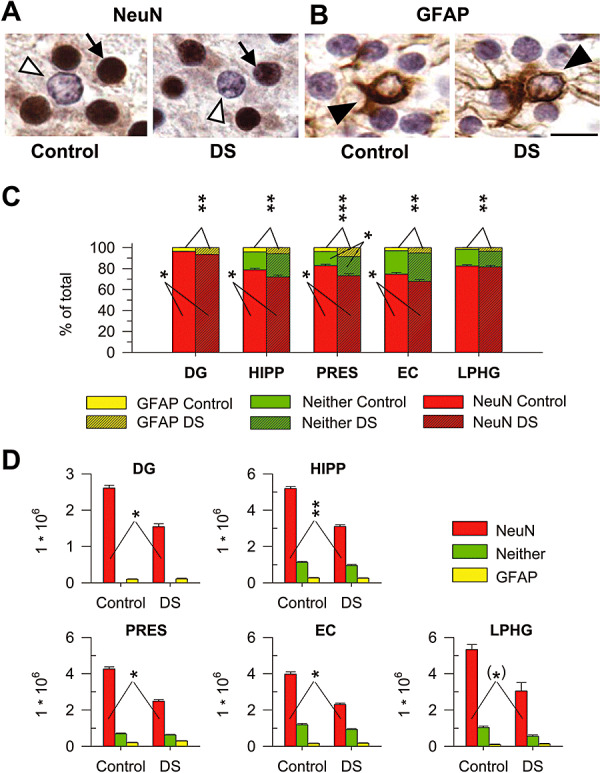
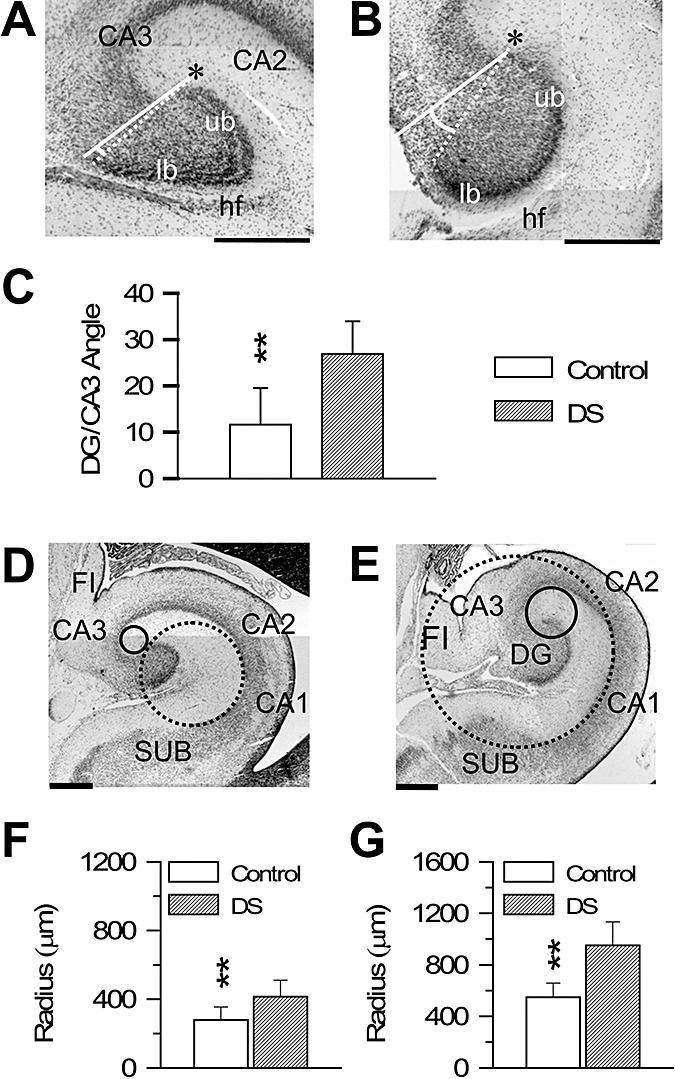
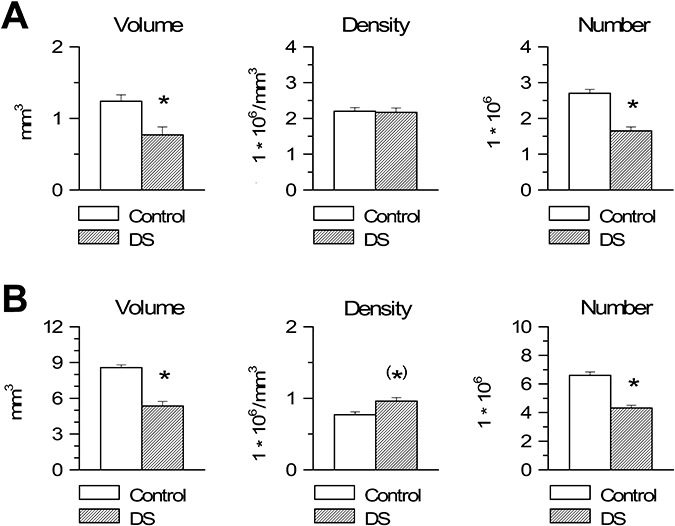
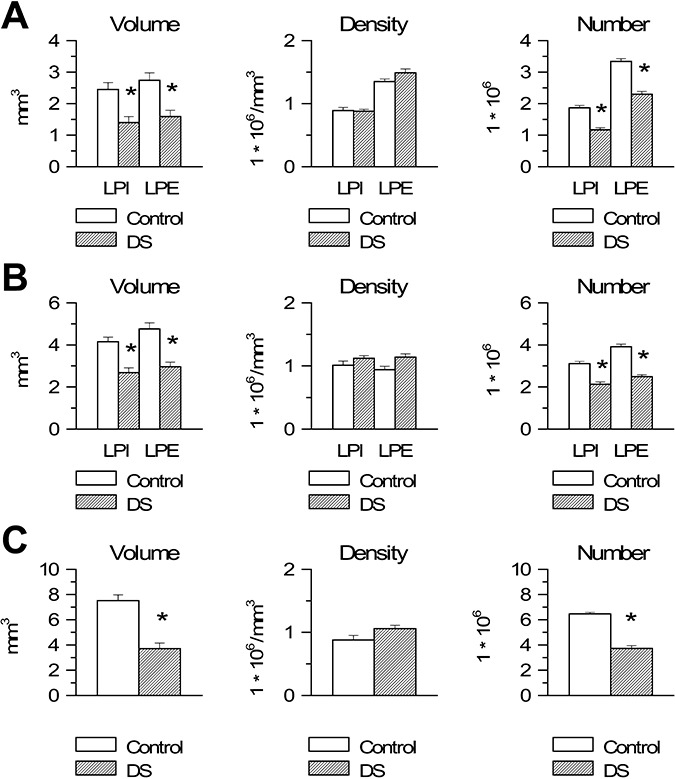
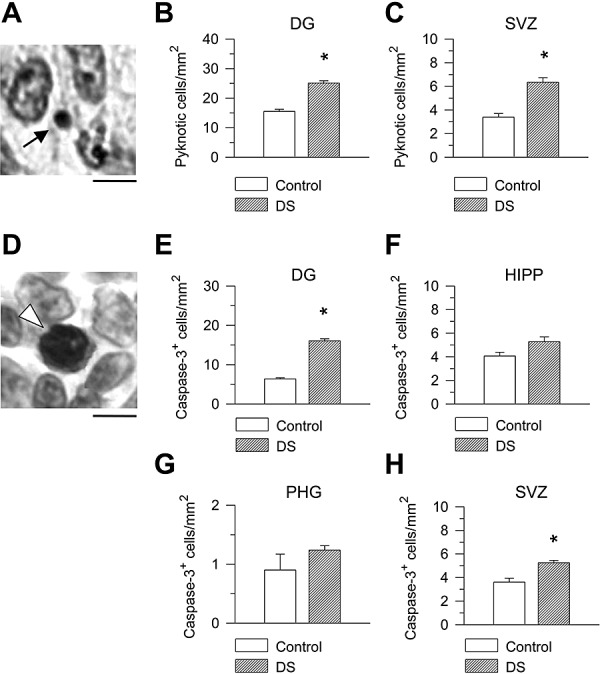
We previously obtained evidence for reduced cell proliferation in the dentate gyrus (DG) of fetuses with Down syndrome (DS), suggesting that the hippocampal hypoplasia seen in adulthood may be caused by defective early neuron production. The goal of this study was to establish whether DS fetuses (17-21 weeks of gestation) exhibit reduction in total cell number in the DG, hippocampus and parahippocampal gyrus (PHG). Volumes of the cellular layers and cell number were estimated with Cavalieri's principle and the optical fractionator method, respectively. We found that in DS fetuses all investigated structures had a reduced volume and cell number. Analysis of cell phenotype showed that DS fetuses had a higher percentage of cells with astrocytic phenotype but a smaller percentage of cells with neuronal phenotype. Immunohistochemistry for Ki-67, a marker of cycling cells, showed that DS fetuses had less proliferating cells in the germinal zones of the hippocampus and PHG. We additionally found that in the hippocampal region of DS fetuses there was a higher incidence of apoptotic cell death. Results show reduced neuron number in the DS hippocampal region and suggest that this defect is caused by disruption of neurogenesis and apoptosis, two fundamental processes underlying brain building.


Figures

Figure 1
Figure 1
A–G. Hippocampal region in human fetuses. Nissl‐stained coronal sections across the hippocampal region of a control fetus (case 164). Sections in A and B were approximately 1 mm and 4 mm caudal to the rostral border of the hippocampal formation, respectively. Section in C is a higher magnification of section in A. The white arrowhead in B and C marks the border between the subiculum and presubiculum and the black arrowhead in C marks the border between presubiculum and EC. The diamond in B indicates the lateral border of the EC and the triangle in C indicates the transition between presubiculum and EC, possibly corresponding to the parasubiculum (see Nomenclature for explanations). Section in D corresponds to the region enclosed by a stippled rectangle in A, rotated 90° clockwise, and shows the layers of the fetal DG and hippocampus. The star indicates the obliterated hippocampal fissure. Sections in E and F correspond to the regions that in A are enclosed by a black and white rectangle, respectively and section in H corresponds to the region that in B is enclosed by a rectangle. Note the presence of a lamina dissecans in the presubiculum (E) and EC (F) but not in the cortex forming the lateral portion of the PHG (G). H–L: Measurements. The manner in which the areas of the granule cell layer, pyramidal layer and cellular laminae of the PHG (stippled contours) were measured is shown in H. I shows an example of counting frames spaced in a 150 µm square grid (fractionator) placed over the hippocampus. A higher magnification of one disector with 30 µm side length is shown in J. The manner by which the DG/CA3 angle and curvature radii of the hippocampus were measured is shown in K and L, respectively. Calibrations: A–C and H = 1000 µm; D–G= 300 µm; K,L = 500 µm. Abbreviations: CA = hippocampus (Cornu Ammonis); CA1, CA2, CA3 = hippocampal fields; CS = collateral sulcus; d = dorsal; DG = dentate gyrus; EC = entorhinal cortex; FI = fimbria; GM = germinal matrix; gr = granule cell layer; hl = hilus; iz = intermediate zone; l = lateral; lb = lower blade; ld = lamina dissecans; lpe = lamina principalis externa; lpi = lamina principalis interna; m = medial; mol = molecular layer; PHG = parahippocampal gyrus; PRES = presubiculum; pyr = pyramidal layer; SUB = subiculum; TH = temporal horn of the lateral ventricle; TNC = temporal neocotex; ub = upper blade; v = ventral; vz = ventricular zone; wm = white matter.
Figure 2
Figure 2
Comparison of the anatomy of the hippocampal region in DS and control fetuses. A–D. Nissl‐stained coronal sections across the hippocampal region of a control (A,C; case 164) and a DS (B,D; case 166) fetus. Sections in C and D are higher magnification of A and B, respectively. The arrow in A and B indicates the collateral sulcus, the double‐headed arrows indicate the lumen of the lateral ventricle and the arrowhead indicates the indentation in the lateral wall of the ventricle. The arrow in C and D indicates the hippocampal fissure and the star marks the point where the hippocampal fissure becomes obliterated. The arrowheads in C and D indicate the stream of cells in the intermediate zone of the hippocampus and the small arrows indicate column of cells en route toward the pyramidal layer. Calibration: A,B = 1000 µm and C,D = 500 µm. Abbreviations: CA1, CA2, CA3 = hippocampal fields; d = dorsal; DG = dentate gyrus; DS = Down syndrome; EC = entorhinal cortex; FI = fimbria; GM = germinal matrix; iz = intermediate zone; H = hippocampus; l = lateral; m = medial; PRES = presubiculum; SUB = subiculum; TH = temporal horn of the lateral ventricle; v = ventral.
Figure 7
Figure 7
Cell proliferation in the hippocampal region of DS and control fetuses. A–E. Coronal sections across the hippocampal region of a control fetus (case 104) immunostained for Ki‐67 and counterstained with Mayer's Haematoxylin. Images in A, B, D and E are higher magnification of the regions enclosed by squares in C. Cells immunostained for Ki‐67 appear labeled in brown: for instance, the cells indicated by the white arrowheads in A and black arrows in B and E. Cells indicated by the black arrowhead in A and D are ependymal cells. The arrowheads in C mark the border of the ventricular zone of the hippocampus and the stippled area indicates the region of the ventricular zone of the PHG where proliferating cells were sampled. The double‐headed white arrow in A and D indicates the outer portion of the ventricular zone. The double‐headed black arrow in A indicates the inner portion of the hippocampal ventricular zone. F–I. Examples of sections immunostained for Ki‐67 and counterstained with Mayer's Haematoxylin from the ventricular zone overlying the hippocampus in a control (F) and a DS (G) fetus and from the outer ventricular zone of the PHG in a control (H) and a DS (I) fetus. Images are from cases 104 (F,H) and 203 (G,I). The double‐headed white arrow in F and G indicates the outer portion of the ventricular zone of the hippocampus. Calibration: A, B, D, E, F–I = 25 µm; and C = 1000 µm. J,K. Density of Ki‐67‐positive cells, expressed as number of cells/mm2 in the outer and inner ventricular zone of the hippocampus (J) and PHG (K). Values are mean ± SEM. *P < 0.05; **P < 0.01; ***P < 0.001 (two‐tailed t‐test). Abbreviations: d = dorsal; DG = dentate gyrus; EC = entorhinal cortex; GM = germinal matrix; HIPP = hippocampus; l = lateral; m = medial; PHG = parahippocampal gyrus; PRES = presubiculum; TH = temporal horn of the lateral ventricle; v = ventral.
Figure 6
Figure 6
Cell phenotype. A,B. Sections immunostained for NeuN (A) and GFAP (B) from the EC of a control (case 164) and a DS (case 203) fetus. The arrow in A marks one of the NeuN‐positive cells and the empty arrowhead marks one NeuN‐negative cell. The filled arrowhead in B marks one GFAP‐positive cell. Calibration = 10 µm. C,D. Percentage (C) and total number (D) of NeuN‐positive cells (red bars), GFAP‐positive cells (yellow bars) and cells that did not express either NeuN or GFAP (green bars) in the cellular layers of the structures forming the hippocampal region of control and DS fetuses. Values are mean ± SEM. *P < 0.05; **P < 0.01; ***P < 0.001 (two‐tailed t‐test). Abbreviations: DG = dentate gyrus; DS = Down syndrome; EC = entorhinal cortex; HIPP = hippocampus; LPHG = lateral parahippocampal gyrus; PRES = presubiculum.
Figure 3
Figure 3
Morphometry of the DG and hippocampus in DS and control fetuses. A,B. Nissl‐stained sections across the DG of a control (A; case 27) and a DS (B; case 133) fetus, showing the manner by which the angle between the DG and CA3 was measured (see Materials and methods). The asterisk indicates the tip of the upper blade. C. Values (mean ± SEM) of the angle between the DG and CA3 in control and DS fetuses. D,E. Nissl‐stained sections across the hippocampal formation of a control (D; case 178) and a DS (E; case 134) fetus, showing the manner by which the curvature radii of the hippocampus at the level of CA3 (continuous circle) and CA1 (stippled circle) were measured (see Materials and methods). F,G. Values (mean ± SEM) of the curvature radius at the level of CA3 (F) and CA1 (G) in control and DS fetuses. Calibration in A, B, D and E=500 µm. **P < 0.01 (two‐tailed t‐test). Abbreviations: CA1, CA2, CA3 = hippocampal fields; DG = dentate gyrus; DS = Down syndrome; FI = fimbria; hf = hippocampal fissure; lb = lower blade; SUB = subiculum; ub = upper blade.
Figure 4
Figure 4
Stereology of the dentate gyrus and hippocampus in Down syndrome (DS) and control fetuses. A,B. Volume (panels on the left), cell density, expressed as number of cells/mm3 (middle panels) and total number of cells (panels on the right) of the granule cell layer (A) and pyramidal layer (B) in DS and control fetuses. Values are mean ± SEM. (*)P < 0.06; *P < 0.05 (two‐tailed t‐test).
Figure 5
Figure 5
Stereology of the parahippocampal gyrus in Down syndrome (DS) and control fetuses. A–C. Volume (panels on the left), cell density, expressed as number of cells/mm3 (middle panels) and total number of cells (panels on the right) of lamina principalis interna (LPI) and lamina principalis externa (LPE) of the presubiculum (A) and entorhinal cortex (B) and of the single cellular lamina of the lateral parahippocampal gyrus (C) in DS and control fetuses. Values are mean ± SEM. *P < 0.05 (two‐tailed t‐test).
Figure 8
Figure 8
Apoptotic cell death in the hippocampal region of DS and control fetuses. A. Nissl‐stained section across the ventricular zone of the parahippocampal gyrus. The morphology of an apoptotic cell (arrow) consists in a pyknotic darkly stained nucleus with very small size and light or absent cytoplasm. Calibration = 5 µm. B,C. Density of pyknotic cells expressed as number of cells/mm2 in the granule cell layer (B) and ventricular zone of the hippocampus and parahippocampal gyrus (C). D. Example of a cleaved caspase‐3‐positive cell (arrowhead) in the ventricular zone of the parahippocampal gyrus. Cells immunostained for cleaved caspase‐3 show intense nuclear immunoreactivity. Calibration = 5 µm. E–H. Density of caspase‐3‐positive cells expressed as number of cells/mm2 in the granule cell layer (E), cellular layers of the hippocampus (F) and PHG (G) and ventricular zone of the hippocampus and parahippocampal gyrus (H). Values are mean ± SEM. *P < 0.05 (two‐tailed t‐test). Abbreviations: DG = dentate gyrus; HIPP = hippocampus; PHG = parahippocampal gyrus; SVZ = subventricular zone.

References

    1. Arnold SE, Trojanowski JQ (1996) Human fetal hippocampal development: I. Cytoarchitecture, myeloarchitecture, and neuronal morphologic features. J Comp Neurol 367:274–292. - PubMed
    1. Aylward EH, Habbak R, Warren AC, Pulsifer MB, Barta PE, Jerram M, Pearlson GD (1997) Cerebellar volume in adults with Down syndrome. Arch Neurol 54:209–212. - PubMed
    1. Aylward EH, Li Q, Honeycutt NA, Warren AC, Pulsifer MB, Barta PE et al (1999) MRI volumes of the hippocampus and amygdala in adults with Down's syndrome with and without dementia. Am J Psychiatry 156:564–568. - PubMed
    1. Bahn S, Mimmack M, Ryan M, Caldwell MA, Jauniaux E, Starkey M et al (2002) Neuronal target genes of the neuron‐restrictive silencer factor in neurospheres derived from fetuses with Down's syndrome: a gene expression study. Lancet 359:310–315. - PubMed
    1. Becker L, Mito T, Takashima S, Onodera K (1991) Growth and development of the brain in Down syndrome. Prog Clin Biol Res 373:133–152. - PubMed

Publication types