. 2007 Dec 19:7:138.
doi: 10.1186/1471-213X-7-138.

Retinoic acid is a potential dorsalising signal in the late embryonic chick hindbrain

Affiliations

Retinoic acid is a potential dorsalising signal in the late embryonic chick hindbrain

Leigh J Wilson et al. BMC Dev Biol. .

Abstract

Background: Human retinoic acid teratogenesis results in malformations of dorsally derived hindbrain structures such as the cerebellum, noradrenergic hindbrain neurons and the precerebellar system. These structures originate from the rhombic lip and adjacent dorsal precursor pools that border the fourth ventricle roofplate. While retinoic acid synthesis is known to occur in the meninges that blanket the hindbrain, the particular sensitivity of only dorsal structures to disruptions in retinoid signalling is puzzling. We therefore looked for evidence within the neural tube for more spatiotemporally specific signalling pathways using an in situ hybridisation screen of known retinoic acid pathway transcripts.

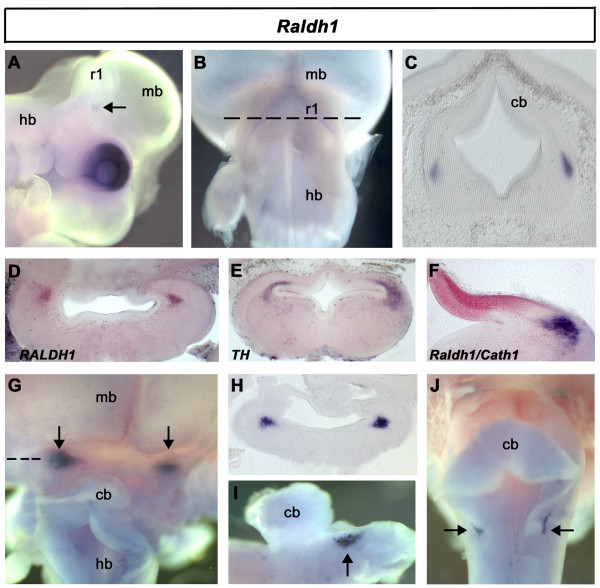
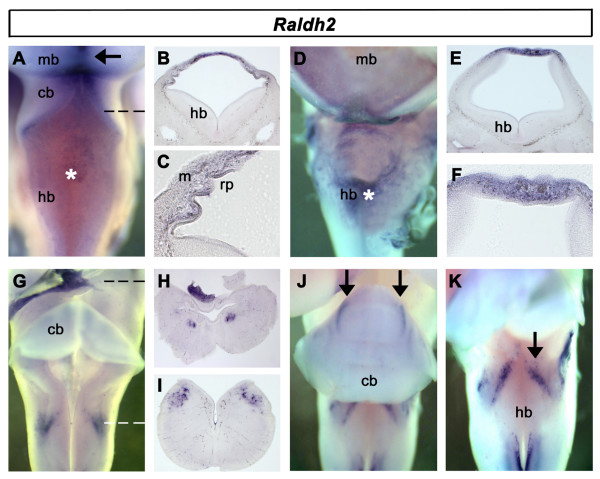
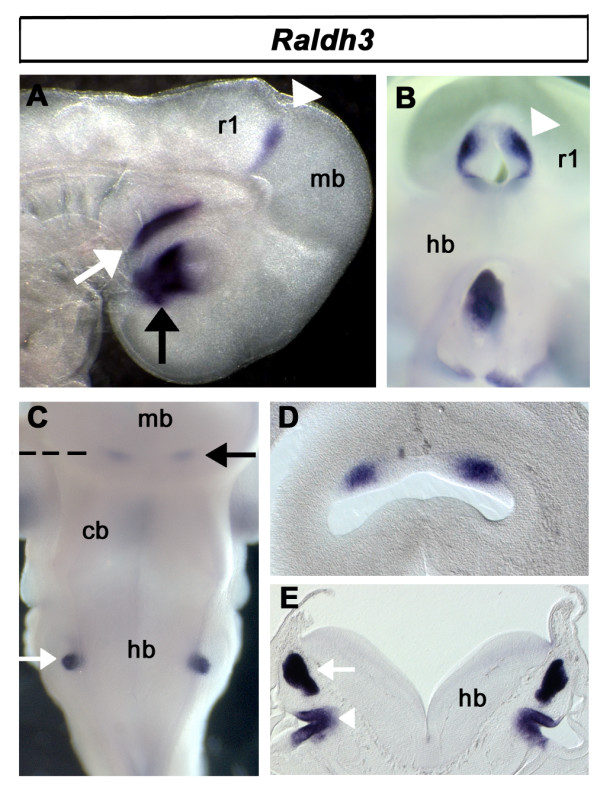
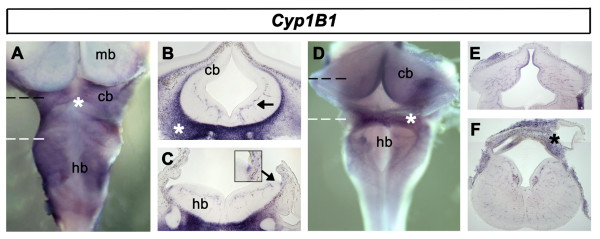
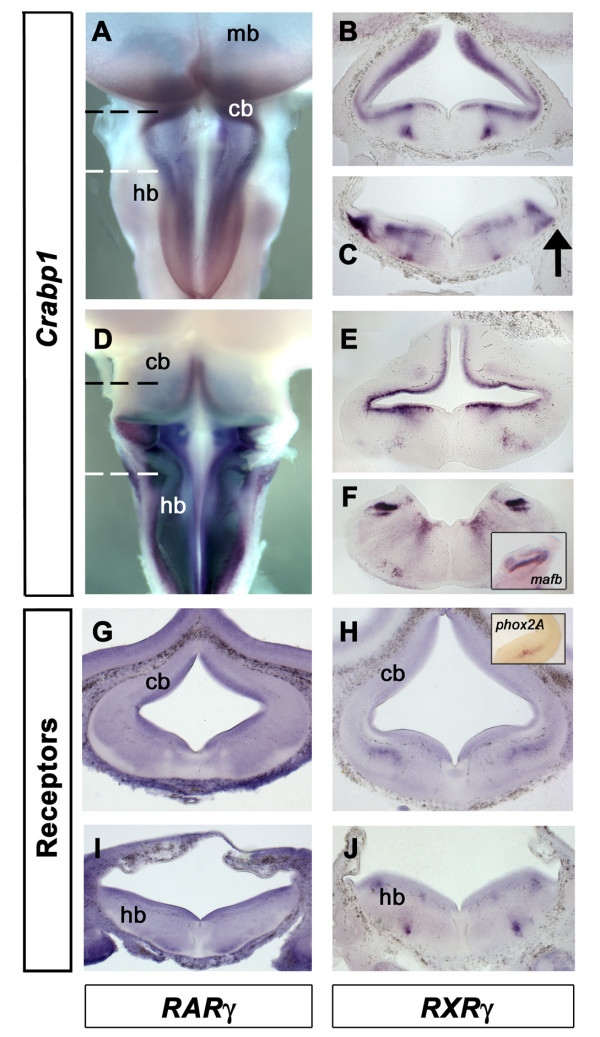
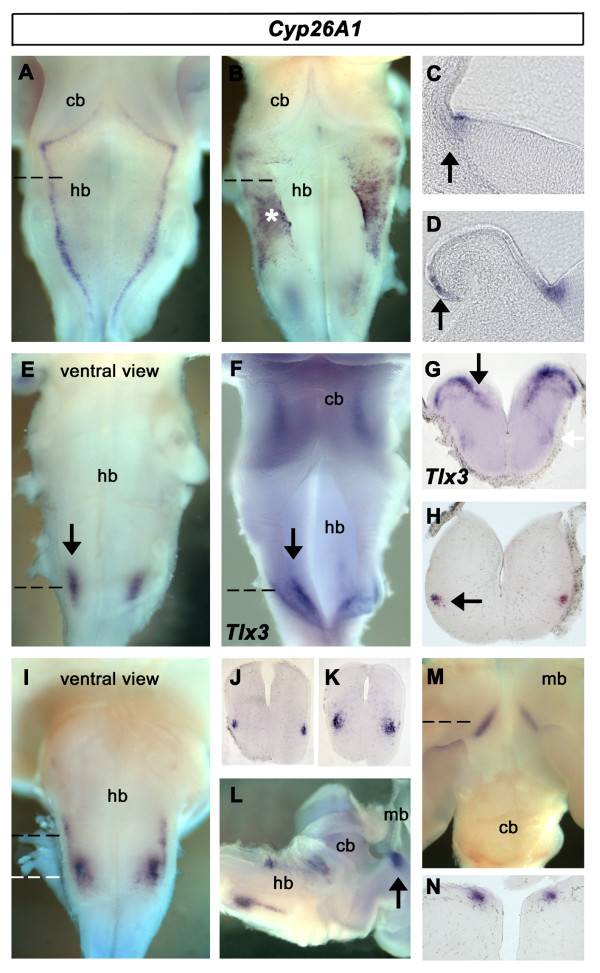
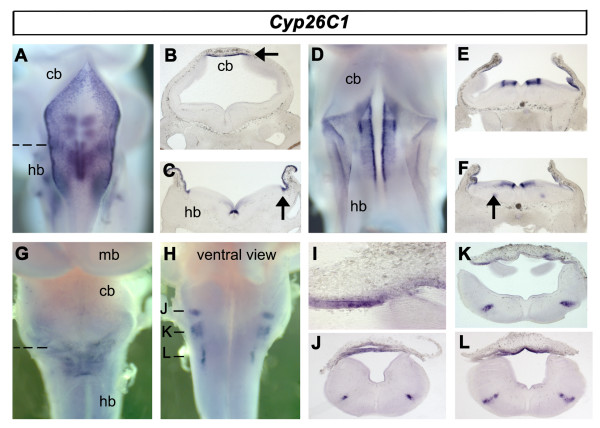
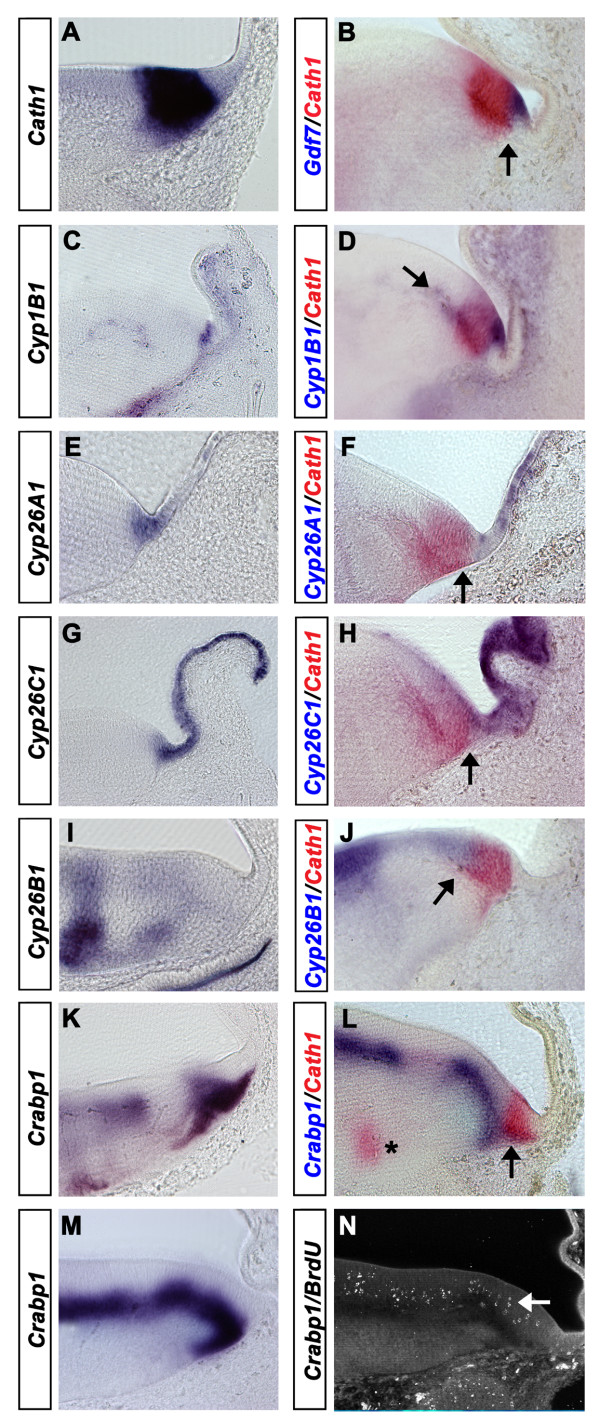
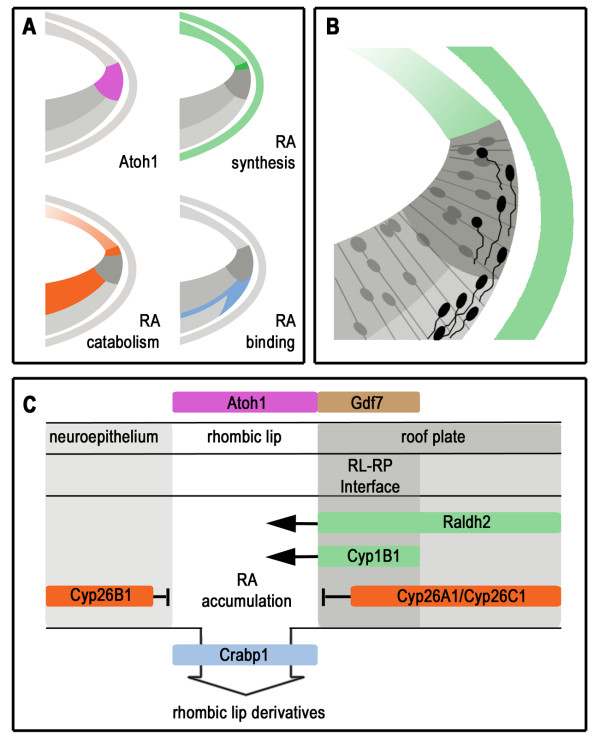
Results: We find that there are highly restricted domains of retinoic acid synthesis and breakdown within specific hindbrain nuclei as well as the ventricular layer and roofplate. Intriguingly, transcripts of cellular retinoic acid binding protein 1 are always found at the interface between dividing and post-mitotic cells. By contrast to earlier stages of development, domains of synthesis and breakdown in post-mitotic neurons are co-localised. At the rhombic lip, expression of the mRNA for retinoic acid synthesising and catabolising enzymes is spatially highly organised with respect to the Cath1-positive precursors of migratory precerebellar neurons.

Conclusion: The late developing hindbrain shows patterns of retinoic acid synthesis and use that are distinct from the well characterised phase of rostrocaudal patterning. Selected post-mitotic populations, such as the locus coeruleus, appear to both make and break down retinoic acid suggesting that a requirement for an autocrine, or at least a highly localised paracrine signalling network, might explain its acute sensitivity to retinoic acid disruption. At the rhombic lip, retinoic acid is likely to act as a dorsalising factor in parallel with other roofplate signalling pathways. While its precise role is unclear, retinoic acid is potentially well placed to regulate temporally determined cell fate decisions within the rhombic lip precursor pool.


Figures

Figure 1
Figure 1
Expression of Raldh1. In situ hybridisation was performed on wholemount embryos with DIG- or fluorescein-labelled riboprobes. Unless otherwise stated, rostral is top, in views of the dorsal embryo, and to the right in lateral views. Abbreviations: midbrain (mb), hindbrain (hb), cerebellum (cb), rhombomere 1 (r1). A. At e3.5, in a lateral view of a wholemount embryo, Raldh1 is located in the eye and presumptive locus coeruleus (LC) of ventral r1 (arrow). B. Dorsal view at e5. C. Transverse section (through level indicated by dashed line in B) identifies expression in the LC. D. Expression at e6 of Raldh1 in a transverse section through rostral rhombomere 1. E. Expression of tyrosine hydroxylase (TH) at e6 in a matched transverse section of rostral r1. F. Transverse section through r1 at e6 showing double in situ hybridisation for Raldh1 (blue) and Cath1 (red). G. Dorsal view of hindbrain at e6.5 showing bilateral expression within putative isthmo-optic territory (arrows). H. Transverse section through the mid/hindbrain (dashed line in G). I. Expression relative to the cerebellum (midbrain removed) in a lateral view at e7 (arrow). J. Expression in vestibuloacoustic territory at e7 (arrows).
Figure 2
Figure 2
Expression of Raldh2. A. Raldh2 is expressed in the membranes overlying the IVth ventricle (*) and dorsal midbrain (arrow) at e3.5. B. Transverse section through rostral hindbrain (dashed line in A) showing roof plate expression. C. Higher magnification of Raldh2 expression (in B) shows Raldh2 in both the mesenchyme (m) and roofplate (rp). D. Expression in the meningeal membranes surrounding the neural tube from e5 (*). E. Transverse section through hindbrain shows expression is concentrated in the meninges. F. Higher magnification of Raldh2 expression in B shows expression through all layers overlying the ventricle. G. Whole embryo at e6.5 with meninges largely removed. H. Transverse section through midbrain (at level indicated by black dashed line in G) shows expression in the oculomotor nucleus. I. Transverse section through caudal hindbrain (at level indicated by white dashed line in G) shows expression in a dorsal neural population. J. Dorsal view of e8 whole embryo with meninges removed shows Raldh2 in restricted parasagittal domains (arrows). K. Dorsal view (same embryo as J) with the cerebellum displaced to reveal dorsal hindbrain expression (arrow).
Figure 3
Figure 3
Expression of Raldh3. A. Raldh3 expression at e3 is localised to the ventral retina of the eye (arrow), Rathke's pouch (white arrow) and the isthmus (white arrowhead). B. En face view of the dissected isthmus (arrow) showing a ring of Raldh2 expression, weakening at its dorsal apex. C. Expression at the isthmus (arrow) and otic vesicle (white arrow) at e6. D. Transverse section through isthmic region (dashed line in C) shows expression concentrated in bilateral foci within the isthmus. E. Transverse section through the presumptive inner ear shows Raldh2 in the endolymphatic duct (white arrow) and saccule (white arrowhead).
Figure 4
Figure 4
Expression of Cyp1B1. A. Cyp1B1 expression at e5 is located in the developing meninges (*). B. Transverse section through the cerebellar region (black dashed line in A) shows expression in the blood vessels within the neural tube (arrow) and the cranial mesenchyme (*). C. Transverse section through the rostral hindbrain (white dashed line in A) reveals expression at the rhombic lip (inset at higher magnification).D. Meningeal membrane expression at e7.5 (*). E. Transverse section through cerebellum at e7.5 (black dashed line in D) shows meningeal, vascular expression. F. Transverse section through e7.5 rostral hindbrain (white dashed line in D) showing expression in the meninges (*) and blood vessels.
Figure 5
Figure 5
Expression of retinoic acid binding and signalling components. A. Dorsal view of Crabp1 in the rhombic lip at e5. B. Transverse section through the cerebellar region (black dashed line in A). Crabp1 lies outside the ventricular layer. Dorsally, apparent ventricular expression is a by-product of the plane of section. C. Transverse section through the hindbrain (white dashed line in A) with the rhombic lip indicated (arrow).D. Dorsal view of an e6 embryo. E. Transverse section through the cerebellum (black dashed line in D). F. Transverse section through the caudal hindbrain (white dashed line in D) shows expression in the magnocellularis and underlying laminaris of the vestibuloacoustic nuclei, as identified by mafB [65] (inset). G. RARγ expression at the level of the cerebellum at e5 is expressed throughout the neural tube. Areas of lower expression correspond to descending axon tracts. H. RXRγ expression at the same axial level is ubiquitous but conspicuously elevated in the locus coeruleus, identified by the expression of TH or Phox2a (inset). I. RARγ in transverse section is uniformly expressed throughout the neural tube. J. In caudal hindbrain, RXRγ is elevated in a discrete column of neurons close to the pial surface.
Figure 6
Figure 6
Expression of Cyp26A1. A. Dorsal view of Cyp26A1 expression in the rhombic lip at e3.5. B. Dorsal view of Cyp26A1 expression in the rhombic lip and roofplate (*) at e5. C. Transverse section through an e3.5 hindbrain (dashed line in A) showing Cyp26A1 expression at the rhombic lip (arrow) D. Transverse section through an e5 hindbrain (dashed line in B), showing punctate expression of Cyp26A1 extending into the roofplate (arrow). E. Ventral view of the hindbrain at e5 shows Cyp26A1 within a discrete population of neurons. F. Tlx3 expression at e5 identifies the noradrenergic area postrema (arrow). G. In section (dashed line in F), the area postrema (arrow) overlies the nucleus ambiguus (white arrow). H. Transverse section through caudal hindbrain (dashed line in E) shows Cyp26A1 expression approximately mapping to neurons that express Tlx3 (arrow). I. Ventral view of hindbrain at e6 shows columnar Cyp26A1 expression. J and K. Transverse sections through rostral and caudal parts of the hindbrain expression domain (dashed black and white lines in I), respectively. L. Lateral view of e6 embryo showing relative positions of hindbrain and midbrain label (arrow). M. Dorsal view of e8 embryo; discrete expression at the caudal margin of the optic tectum (arrow). N. Transverse section through midbrain expression domains (dashed line in M).
Figure 7
Figure 7
Expression of Cyp26B1.A. Cyp26B1 expression at e4 in rhombomere 1 (arrow) characterises the cerebellar anlage and a complex patchwork of hindbrain domains, including a dense, lateral column of expression within rhombomeres 5 and 6 (white arrow). B. Locus coeruleus (arrow) and ventricular zone (*) in transverse section (at level indicated by black arrow in A). C. Transverse section through the caudal hindbrain (indicated by dashed line in A) showing expression in discrete patches of proliferating cells. D. Transverse section through rhombomere 5 (white arrow in A) reveals expression in both the ventricular layer and within post-mitotic neuronal populations. E. Distinct longitudinal patterns of expression are maintained at e5. F. Lateral view of e5 cerebellum and midbrain with locus coeruleus expression (arrow). G. Ventral view of mid-hindbrain domain of an e5 embryo showing expression in the region of the isthmo-optic nucleus (arrowhead). H. Expression at e7.5 assumes a defined rostrocaudal pattern incorporating the cerebellum, with the caudal limit at the level of rhombomere 6 (white arrow). I. Ventricular expression in a transverse section (indicated by dashed white line in H) within the cerebellum. J. Transverse section through caudal hindbrain (indicated by white arrow in H) showing expression in ventricular layer and pial membrane (pia, arrow).
Figure 8
Figure 8
Expression of Cyp26C1. A. At e3.5, expression characterises the roof plate, rhombic lip and ventral hindbrain (out of focal plane). B. Transverse section through caudal rhombomere 1 showing roof plate expression (arrow). C. Transverse section through the caudal hindbrain (dashed line in A) showing expression in the roof plate, rhombic lip and in cells adjacent to the floor plate. D. Expression at e5 is similar to that at e3.5. E. Transverse section at the level of rhombomere 4 shows that ventral Cyp26C1 expression is limited to the ventricular layer. F. In addition, at the level of rhombomeres 5 and 6, Cyp26C1 characterises a discrete column of post-mitotic neurons (arrow). G. Rat e6.5, a dorsal view of the hindbrain shows Cyp26C1 is still present in the roofplate. H. Ventral view of the same hindbrain shows three ventrolateral Cyp26C1-positive populations in the caudal hindbrain. I. Transverse section through fourth ventricle roof plate (indicated in G). J, K, L. Transverse sections through the caudal hindbrain at positions indicated in H show expression coincident with elevated levels of RXRγ (Fig. 5J).
Figure 9
Figure 9
Retinoid signalling at the rhombic lip. Transverse sections taken through the caudal hindbrain at e5 with the roof plate orientated to the right and the dorsal neuroepithelium to the left. A. Cath1 expression at the rhombic lip. B. Cath1 (red) and Gdf7 (in blue) show a non-overlapping interface (arrow). C. Cyp1B1 expression in dorsal neural tube shows a similar expression to Gdf7. D. Cath1 (red) and Cyp1B1 (blue) show no overlap of expression. Cyp1B1 is expressed within the developing blood vessels at the base of the ventricular layer (arrow). E. Cyp26A1 is expressed within the roof plate with highest expression close to the rhombic lip. F. Cath1 (red) and Cyp26A1 (blue) are non-overlapping at their interface (arrow). G. Cyp26C1 is expressed more uniformly throughout the roofplate than Cyp26A1 (E). H. Cath1 (red) and Cyp26C1 (blue) expression is non-overlapping (arrow). I. Cyp26B1 expression is excluded from the rhombic lip J. Cath1 (red) and Cyp26B1 (blue) show complementary expression domains at the ventricular layer boundary of the rhombic lip. K. At the level of the VIIth nerve exit point, Crabp1 is expressed at the interface between ventricular zone and mantle layer. L. Cath1 (red) expression partially overlaps that of Crabp1 (blue) at the interface of the ventricular zone (arrow). Transient spots of Cath1 expression at the exit point of the VIIth nerve are visible at this level (asterisk). Intriguingly, this post-mitotic expression of Cath1 corresponds with a distinct gap in Crabp1 at the overlying ventricular layer boundary. M. At a slightly more rostral level, Crabp1 expression is continuous beneath the ventricular layer. At all levels, there is an extended tail of expression into the mantle layer at the rhombic lip. N. Confocal micrograph of BrdU localisation in s-phase nuclei (arrow).
Figure 10
Figure 10
Summary of results and a model of retinoic acid signalling at the rhombic lip. A. Schematic summary of in situ hybridisation expression domains showing: Cath1 (pink) at the rhombic lip; retinoic acid (RA) synthesis (green: Raldh2 &Cyp1B1) in the roof plate and in the meninges; retinoic acid catabolism (orange: Cyp26A1, Cyp26B1, and Cyp26C1) in the ventricular zone and in the roof plate; retinoic acid binding (blue: Crabp1) in the mantle layer. B. Cellular events illustrated against the same template as in A, where proliferative cells (grey) and migrating rhombic lip derivatives (black) are shown relative to the production of RA (green) C. Model of retinoic acid accumulation resulting from interplay and spatial distribution of retinoic acid signalling components within the dorsal neuroepithelium (left), rhombic lip (middle) and roof plate (right). Expression patterns predict a high concentration of retinoic acid at the rhombic lip. Crabp1 could either play a role in buffering RA or in facilitating its transport to the nucleus as cells exit division. Receptor expression (RAR and RXR) is uniform across the rhombic lip and therefore unlikely to confer signalling specificity.

References

    1. Maden M. Retinoid signalling in the development of the central nervous system. Nat Rev Neurosci. 2002;3:843–853. doi: 10.1038/nrn963. - DOI - PubMed
    1. Marshall H, Nonchev S, Sham MH, Muchamore I, Lumsden A, Krumlauf R. Retinoic acid alters hindbrain Hox code and induces transformation of rhombomeres 2/3 into a 4/5 identity [see comments] Nature. 1992;360:737–741. doi: 10.1038/360737a0. - DOI - PubMed
    1. Durston AJ, Timmermans JP, Hage WJ, Hendriks HF, de Vries NJ, Heideveld M, Nieuwkoop PD. Retinoic acid causes an anteroposterior transformation in the developing central nervous system. Nature. 1989;340:140–144. doi: 10.1038/340140a0. - DOI - PubMed
    1. Gale E, Zile M, Maden M. Hindbrain respecification in the retinoid-deficient quail. Mech Dev. 1999;89:43–54. doi: 10.1016/S0925-4773(99)00202-6. - DOI - PubMed
    1. Gavalas A. ArRAnging the hindbrain. Trends Neurosci. 2002;25:61–64. doi: 10.1016/S0166-2236(02)02067-2. - DOI - PubMed